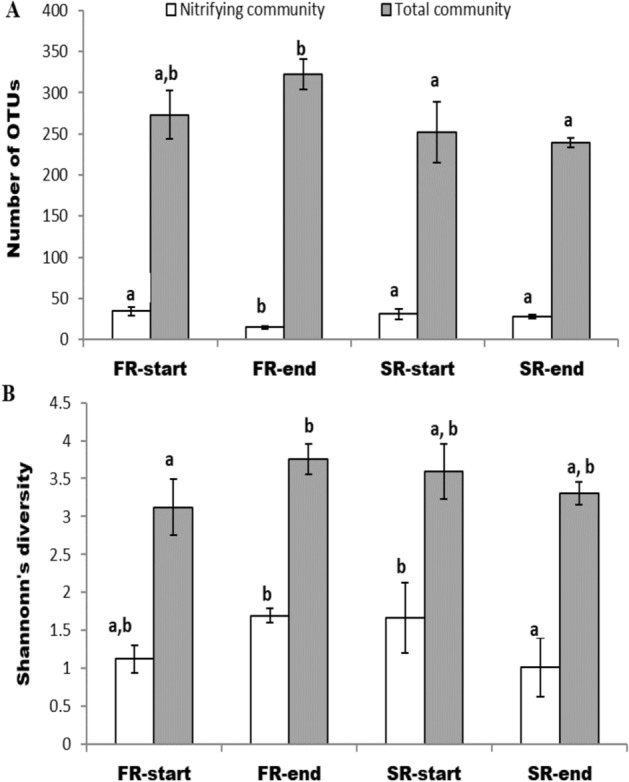
Figure 5.

Diversity indices based on the pyrosequencing data of the total and the nitrifying communities. (A) Richness (observed OTUs). (B) Shannon’s diversity index. For freshwater reactor (FR): F3–F6 (FRstart) and F9–F14 (FRend). For seawater reactor (SR): S3–S6 (SRstart), and S10–S13 (SRend). Equal letters (a, b) above bars indicate no significant difference (p > 0.05) and different letters (a, b) indicate significant statistical differences (p < 0.05) by ANOVA and Tukey’s multiple comparisons. Error bars show standard error of the mean.
