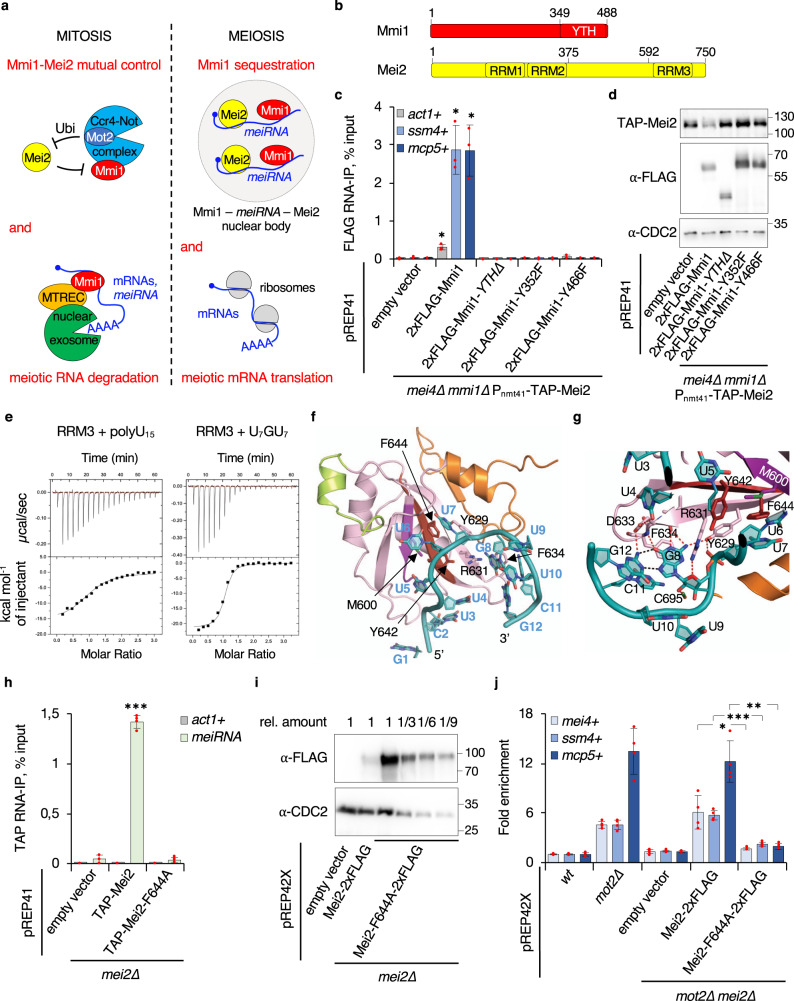
Fig. 1. Mmi1 and Mei2 RNA-binding activities are required for their mutual control.
a Scheme summarizing the functional relationships between Mmi1 and Mei2 during mitosis and meiosis. b Domain organization of Mmi1 and Mei2 proteins. c Enrichments (% input; mean ± SD; n = 3 or 4) of act1 + , ssm4 + and mcp5 + mRNAs upon pulldown of 2xFLAG-tagged wt or mutant Mmi1. Student’s t test (two-tailed) was used to calculate p-values. Between cells expressing pREP41-2xFLAG-Mmi1 and empty vector, p = 0.01865 (act1 + ); 0.0166 (ssm4 + ); 0.01819 (mcp5 + ) (0.05 > *>0.01). d Western blots showing total TAP-tagged Mei2 levels in cells of the indicated genetic backgrounds. Anti-FLAG and anti-CDC2 antibodies were used as Mmi1 expression and loading controls, respectively. e Upper panels: ITC data obtained by injecting poly-U15 or U7GU7 RNAs to RRM3Mei2. Lower panels: Fitting of the binding curves using a single binding site model. f Crystal structure of RRM3Mei2 bound to the GCUUUUUGUUCG RNA (cyan). The classical RRM fold is shown in pink, with RNP1 and RNP2 motifs highlighted in brown and purple, respectively. The RNP1 F644 side chain is shown as sticks. The N- and C-terminal extensions are colored in green and orange, respectively. g Detailed representation of G8 binding mode. Hydrogen bonds involved in specificity for G8 are shown as red (protein–RNA interaction) or black (Hoogsteen based pairs between G8 and G12 bases) dashed lines. h Enrichments (% input; mean ± SD; n = 3 or 4) of act1 + mRNAs and meiRNA upon pulldown of TAP-tagged wt or mutant (Mei2-F644A) Mei2. Student’s t test (two-tailed) was used to calculate p-values. Between cells expressing pREP41-TAP-Mei2 and empty vector, p = 4.32 × 10⁻⁷ (meiRNA) (***<0.001). i Western blots showing total levels of 2xFLAG-tagged wt or mutant Mei2. Serial dilutions of the mutant extract are shown for comparison with wild type. Anti-CDC2 antibody was used as loading control. j RT-qPCR analyses of mei4 + , ssm4 + and mcp5 + meiotic mRNA levels (mean ± SD; n = 4; normalized to act1 + and relative to wt) in cells of the indicated genetic backgrounds. Student’s t test (two-tailed) was used to calculate p-values. Between mot2∆ mei2∆ cells expressing pREP42X-Mei2-2xFLAG and pREP42X-Mei2-F644A-2xFLAG, p = 0.02219 (mei4 + ) (0.05 > *>0.01); 0.00035 (ssm4 + ) (***<0.001); 0.00338 (mcp5 + ) (0.01 > **>0.001). c, h, j Individual data points are represented by red circles.

