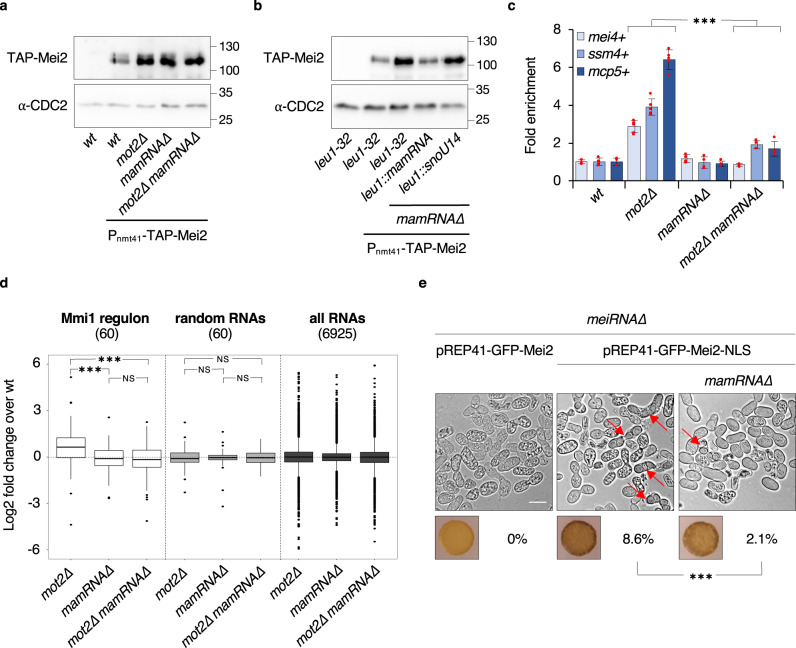
Fig. 3. mamRNA mediates the Mmi1–Mei2 mutual control.
a, b Western blots showing total TAP-tagged Mei2 levels in cells of the indicated genetic backgrounds. Anti-CDC2 antibody was used as loading control. In b, mamRNA or snoU14 were integrated at the leu1 + locus. c RT-qPCR analyses of mei4 + , ssm4 + and mcp5 + meiotic mRNA levels in cells of the indicated genetic backgrounds (mean ± SD; n = 4 or 5; normalized to act1 + and relative to wt). Student’s t test (two-tailed) was used to calculate p-values. Between mot2∆ and mot2∆ mamRNA∆ cells, p = 0.00008 (mei4 + ); 0.00011 (ssm4 + ); 1.08 × 10⁻⁶ (mcp5 + ) (***<0.001). Individual data points are represented by red circles. d Comparison of wt, mot2∆, mamRNA∆ and mot2∆ mamRNA∆ transcriptomes by RNA-sequencing (n = 2). Box plots showing the fold enrichment (log2) of RNAs in mutants relative to wt. Left: analysis of 60 transcripts regulated by Mmi1 as defined in ref. 13 (cluster 1); Middle: analysis of 60 random transcripts; Right: analysis of all transcripts identified. Box center lines represent the median, box limits represent the upper and lower quartiles, whiskers define the 1.5x interquartile range and individual points correspond to outliers. An Anova test was used to calculate p-values. Between mot2∆ and mamRNA∆, p = 0.00046 (***<0.001). Between mot2∆ and mot2∆ mamRNA∆, p = 0.00026 (***<0.001). NS: not significant. e Mating/sporulation efficiencies of the indicated homothallic strains (% tetrads; nmeiRNA∆ pREP41-GFP-Mei2 = 699 cells; nmeiRNA∆ pREP41-GFP-Mei2-NLS = 579; nmeiRNA∆ mamRNA∆ pREP41-GFP-Mei2-NLS = 674), as determined by iodine staining and live cell imaging. Red arrows point to tetrads. A Fisher exact test (two-sided) was used to calculate the p-value. p = 1.1517 × 10⁻⁷ (***<0.001). The white scale bar represents 10 µm.

