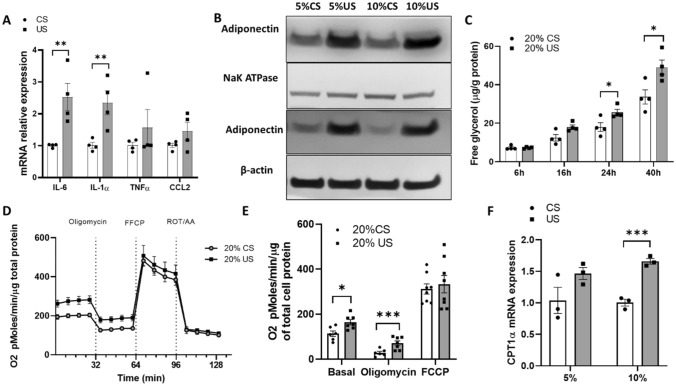
Figure 1.
Adipokine expression and glycerol release in 3T3-L1 adipocytes is increased after uremic serum exposure. Differentiated 3T3-L1 cells were exposed to different concentrations of control and uremic serum. (A) IL-6, IL-1⍺, TNF⍺ and CCL2 mRNA expression levels assessed by RT-qPCR after cells were exposed to 10% uremic and 10% control serum. (B) Adiponectin content assessed by western blot in membrane and cytosolic compartment after 3T3-L1 cells were exposed to control and uremic serum (cropped membrane, full length blots are presented in Figure S4). (C) Free glycerol in media from 3T3L1 after treatment with control and uremic serum for 24 h. (D,E) OCR measurements in 3T3-L1 cells treated with control and uremic serum for 24 h. (E) Shows the representative time course data for OCR. (E) Shows the aggregated data. Data from OCR experiments represent the mean of four technical replicates from two representative experiments. (F) CPT-1α mRNA expression levels assessed by RT-qPCR after cells were exposed to 5–10% uremic and control serum. Unpaired t test, n = 4 for (A–D), experiments were done in triplicate, error bars represent SEM. *p < 0.05 **p < 0.01 C, control. U, uremic. Full length blots are presented in Figure S4.

