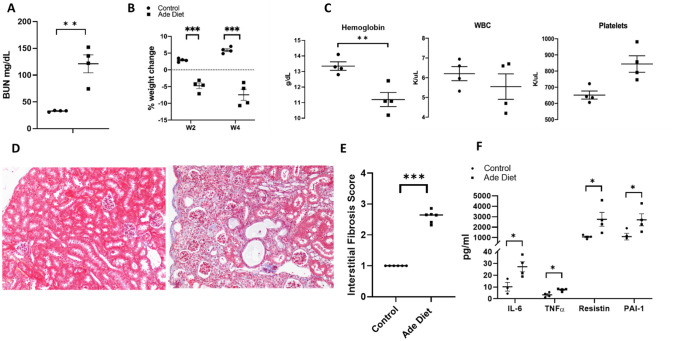
Figure 5.
Phenotypic characteristics of adenine diet induced chronic kidney disease mice. (A) BUN level (mg/dL) in WT adenine diet fed mice versus control mice. (B) Difference in % of weight change at week 2 and week 4 of treatment between control and adenine diet treated mice. (C) Difference in hemoglobin (g/dL), white blood cells (K/μL), and platelets (K/μL) between the control group and the adenine diet group. (D) Representative photographs of sections of Masson Trichrome stained renal tissue from 2 animals treated with control or adenine diet for 4 weeks. Left panel of control animal shows preserved tubules, whereas the right panel demonstrates atrophic tubules with inflammatory interstitial infiltrate, (E) Interstitial fibrosis score of control and adenine diet groups on Masson Trichrome stained sections. At least 10 fields per mice were used at 20× magnification. (F) Comparison of cytokine values between the control group and the adenine diet group. Unpaired t test, n = 4, error bars represent SEM *p ≤ 0.05, **p < 0.01, ***p < 0.001. BUN, blood urea nitrogen. WT, wild type. Ade, adenine diet. WBC, white blood cells. PLT, platelets.

