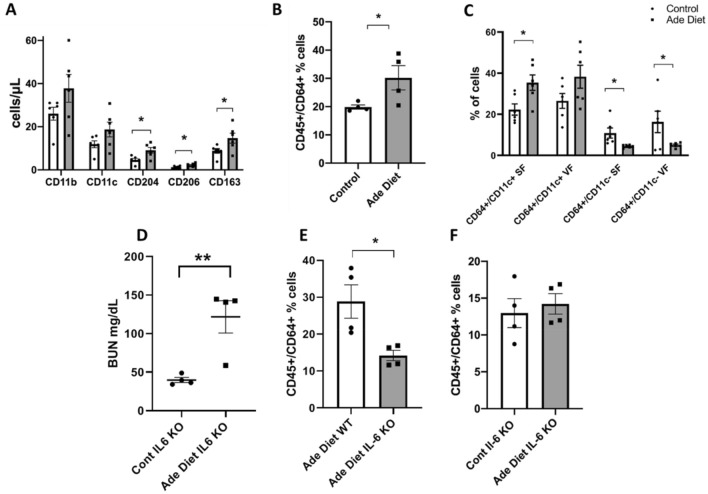
Figure 6.
Peripheral and adipose tissue macrophage characteristics in uremia. (A) Peripheral blood flow cytometry showing the expression of different macrophage markers in adenine diet-induced mice versus control. (B) Adipose tissue flow cytometry showing the % of CD45+/CD64+ cells (macrophages) in adenine diet mice versus control mice. (C) Difference in % of expression of CD64+/CD11c+ and CD64+/CD11c- macrophage phenotypes in subcutaneous and visceral fat. (D) BUN level (mg/dL) in IL6 KO mice after adenine diet versus IL6 KO control mice. (E) Percentage of CD45+/CD64+ cells in adenine diet treated wild type and IL-6 KO mice; (F) Percentage of CD45+/CD64+ cells in IL-6 KO mice treated with adenine diet versus control. Unpaired t test, n = 4 for (B), (D), (E), n = 6 for (A), (C), error bars represent SEM *p ≤ 0.05. SF, subcutaneous fat. VF, visceral fat. Ade, adenine diet. Cont, control. KO, knockout.

