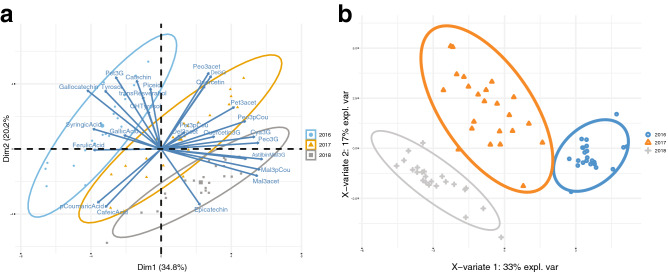
Figure 2.
(a) Principal component analysis biplot of combined PCs measured in individual fermentation replicates of Malbec wines from the 2016, 2017 and 2018 vintages. Ellipses that overlap are not significantly different from one another at the 95% level. (b) PLS-DA plot for the vintages. Samples of 2016 are represented with color blue, 2017 with orange, and 2018 with grey. Legend: Del3G = Delphinidin 3-O-glucoside, Cya3G = Cyanidin 3-O-glucoside, Pet3G = Petunidin 3-O-glucoside, Peo3G = Peonidin 3-O-glucoside, Mal3G = Malvidin 3-O-glucoside, Del3acet = Delphinidin 3-O-acetylglucoside, Pet3acet = Petunidin 3-O-acetylglucoside, Peo3acet = Peonidin 3-O-acetylglucoside, Mal3Acet = Malvidin 3-O-acetylglucoside, Pet3pCou = Petunidin 3-O-p-coumaroylglucoside, Peo3pCou = Peonidin 3-O-p-coumaroylglucoside, Mal3pCou = Malvidin 3-O-p-coumaroylglucoside, GallicAcid = Gallic acid, OHTyrosol = OH-tyrosol, Tyrosol = Tyrosol, Catechin = (+)-Catechin, SyringicAcid = Syringic acid, Epicatechin = (−)-Epicatechin, Astilbin = Astilbin, CafeicAcid = Caffeic acid, pCoumaricAcid = p-coumaric acid, FerulicAcid = Ferulic acid, Piceid = trans-piceid, transResveratrol = Trans-resveratrol, Quercetin3G = Quercetin-3-glucoside, Quercetin = Quercetin, Gallocatechin = (−)-Gallocatechin. The figure was generated using Adobe Illustrator, version 22.1.0 (https://www.adobe.com/products/illustrator.html), Rpackage factoextra—‘factoextra’ and R-package mixOmics—‘mixOmics’.

