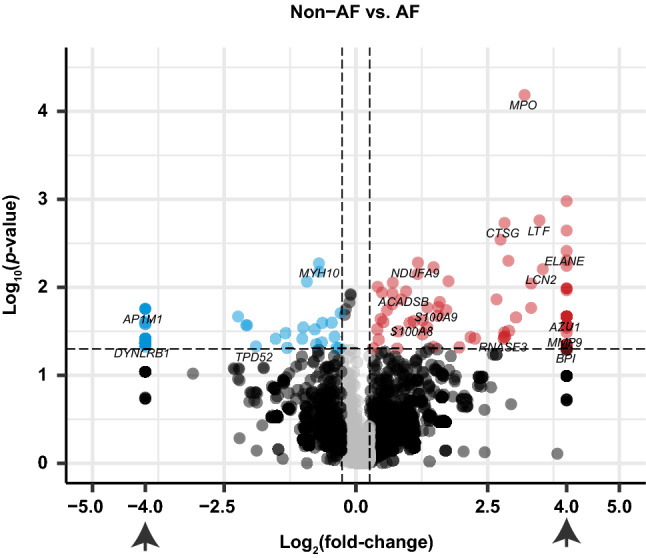
Figure 1.

Volcano plot of the 3153 proteins identified by LC–MS/MS. The volcano plot shows the fold-change (x-axis) versus the significance (y-axis) of the identified 3153 proteins. The significance (non-adjusted p-value) and the fold-change are converted to −Log10(p-value) and Log2(fold-change), respectively. The vertical and horizontal dotted lines show the cut-off of fold-change = ± 1.2, and of p-value = 0.05, respectively. Those proteins with N/A fold-change are plotted on Log2(fold-change) = ± 4 (arrows). There were 115 proteins increased by > 1.2-fold with p-value < 0.05 in AF (upper-right, dots colored red), and there were 55 proteins that were decreased by < − 1.2-fold with p-value < 0.05, (upper-left, dots colored blue). The volcano plot was generated using R software54 (version 3.5.3).
