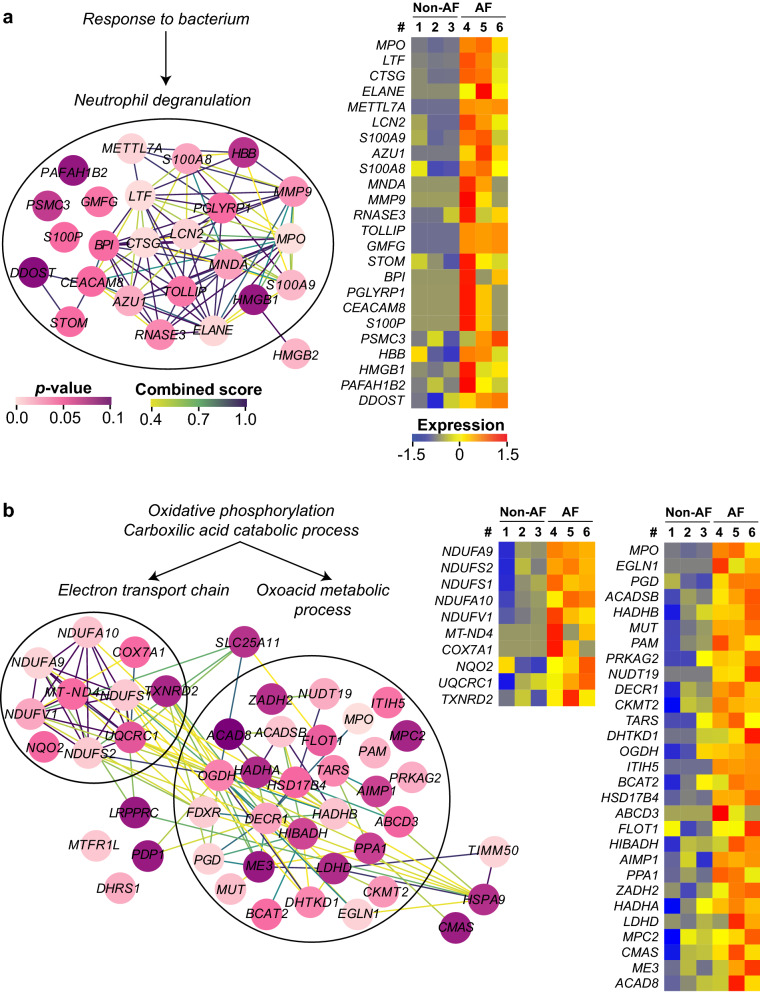
Figure 3.
The PPI of the leading edge in the up-regulated gene-sets in AF. The PPI of each leading edge and their expression profile (heatmap) that were derived from (a) Response to bacterium, or (b) Oxidative phosphorylation and Carboxylic acid catabolic process. Among each gene-set, functionally grouped nodes (proteins) are encircled with its corresponding GO terms. Only the proteins with non-adjusted p-value < 0.1 are displayed here. The color of the nodes and the edges represent the non-adjusted p-value (0–0.1) and the STRING combined score (0.4–1.0), respectively. The color scale of expression represents the z-score of normalized spectral counts of each protein (shown as its gene name in each heatmap). The heatmaps were generated using R software54 (version 3.5.3).

