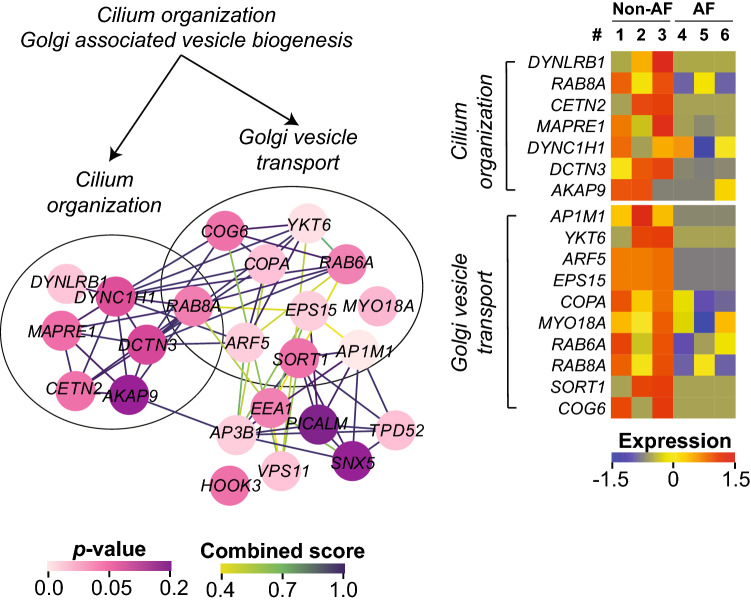
Figure 4.
The PPI of the leading edge in the down-regulated gene-sets in AF. The PPI of the leading edge and the expression profile that were derived from Cilium organization and Golgi associated vesicle biogenesis. Only the proteins with non-adjusted p-value < 0.2 are displayed here. The color of the nodes and the edges corresponds to the non-adjusted p-value (0–0.2) and the STRING combined score (0.4–1), respectively. The color scale of expression represents the z-score of normalized spectral counts of each protein (shown as its gene name in each heatmap). The heatmaps were generated using R software54 (version 3.5.3).

