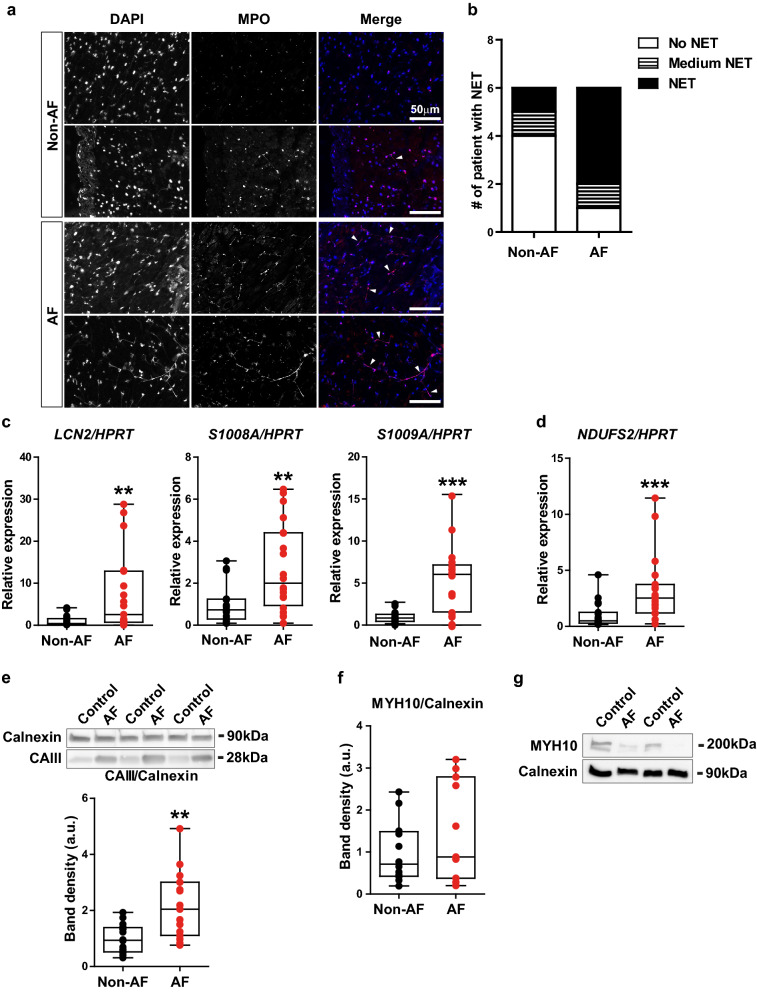
Figure 6.
The validation of up-regulated and down-regulated biological processes in an independent cohort. (a) The representative fluorescent images of DAPI (the left column), MPO (middle) and merge (DAPI as blue signal and MPO as red signal) from non-AF patients (n = 2) and persistent AF patients (n = 2). Note that the fibre-like DAPI staining is co-stained with anti-MPO antibody (arrow heads in merge). Bar, 50 μm. (b) The number of patients whose left atrial tissue shows no NET, medium NET (localized and/or infrequent observation of NET) and NET (extensive and clear observation of NET). Non-AF: n = 6, persistent AF: n = 6. (c) The gene expression of LCN2, S100A8 and S100A9 in the left atrial tissue of patients. N = 18–20/group. The gene expression of HPRT serves as an internal control. (d) The gene expression of NDUFS2 in the left atria tissue of patients. N = 19/group. (e) Protein levels of CAIII in the left atrial tissue of patients. The representative images of the bands are cropped from the same membrane immunoblotted with anti-Calnexin (internal control) and anti-CAIII antibody. The quantification of band density is shown below. N = 15–16/group. (f) Protein levels of MYH10 in the left atrial tissue of patients. (g) Protein levels of MYH10 in the fibroblast fraction isolated from the left atrial tissue of patients. **p < 0.01, ***p < 0.001.

