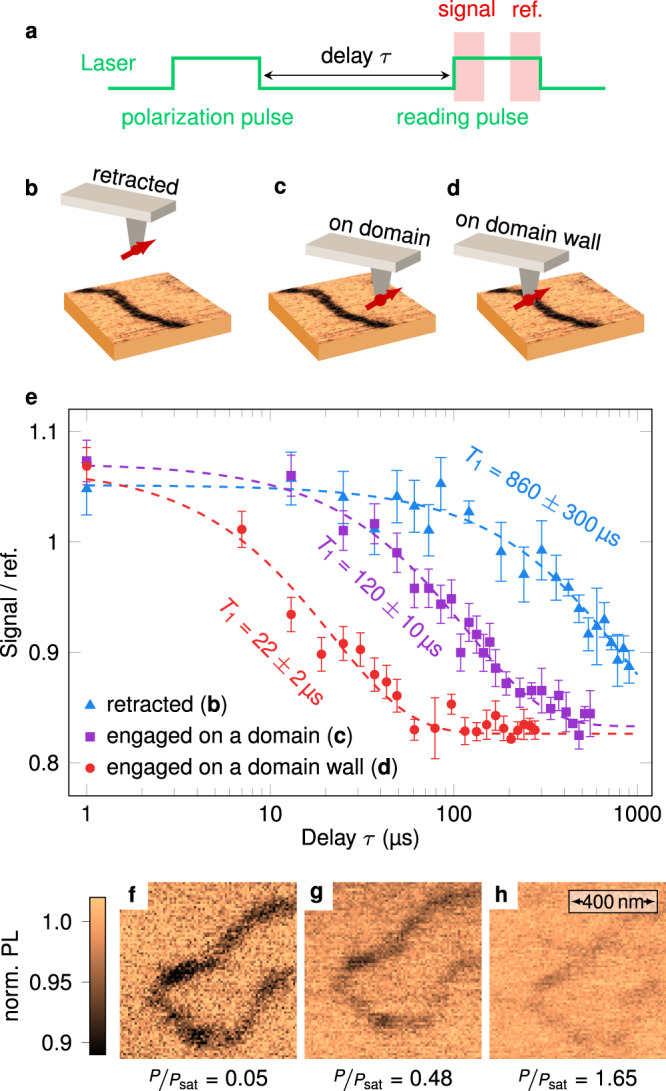
Fig. 3. Measurement of the NV spin relaxation time.

a Experimental sequence used to measure T1. The spin-dependent PL signal is integrated at the beginning of the reading pulse (300 ns window), and normalized using a reference PL value obtained at the end of the pulse37. b–d Sketches of the position of the NV sensor with respect to the magnetic structure. The tip is either b retracted, c engaged above a domain, or d engaged above a domain wall. e NV spin relaxation curves measured for the three different tip positions. The T1 time is obtained from a fit to an exponential decay (dashed lines). f–h PL quenching images recorded above the same domain wall with increasing excitation laser power P. In these experiments the saturation power of the NV defect optical transition is Psat = 450 μW. For the images shown in panels f–h, the values of the PL rate above the uniform domain (bright area) are 7 × 10³ s−1, 50 × 103 s−1 and 100 × 103 s−1, respectively. The acquisition time per pixel is 150 ms for all measurements.
