
Fig. 4. Origin of the magnetic noise.
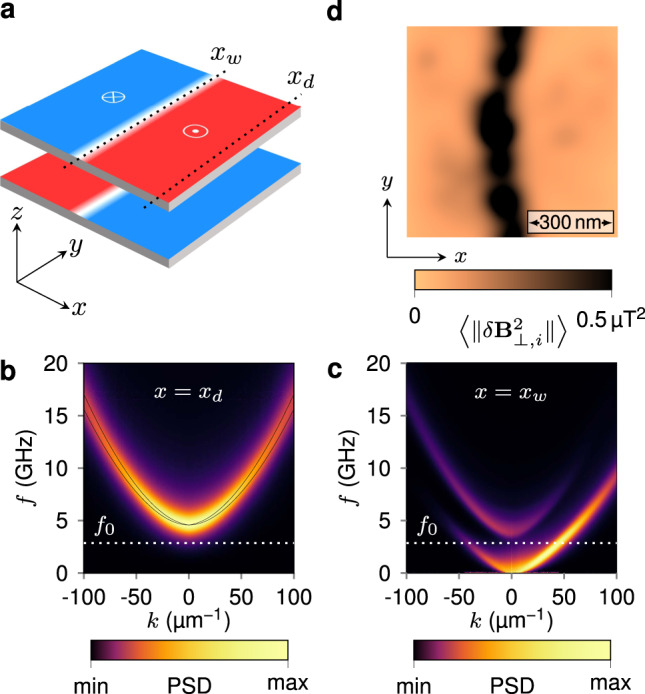
a Equilibrium domain wall configuration obtained by micromagnetic simulation. xw and xd indicate lines along which spin wave propagation is characterized. b Dispersion relation of the propagating spin wave modes in the SAF domain, taken at x = xd in a. The solid lines indicate a theoretical prediction, while the color map represents the power spectral density (PSD) computed from the damped transient response in micromagnetic simulations. c Dispersion relation of the channeled domain wall spin waves computed at x = xw in a. The white dashed lines in b, c indicate the position of ESR frequency of the NV defect at zero field, f0 = 2.87 GHz. d Simulated map of the magnetic noise intensity at the frequency f0, computed at a flying distance dNV = 80 nm above a domain wall configuration in the presence of disorder. The quantity 〈∥δB⊥,i∥2〉 denotes the noise intensity perpendicular to the NV quantization axis, which is obtained from an average over 500 different realizations of the random driving field.