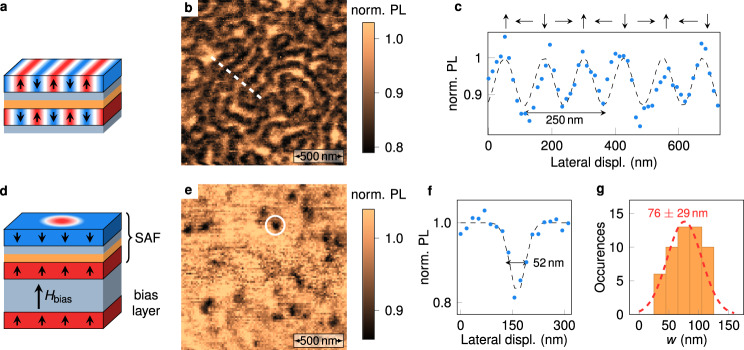
Fig. 5. Imaging antiferromagnetic spin spirals and skyrmions via single spin relaxometry.
a Sketch of a SAF sample hosting a spin spiral. The composition of the stack is identical to the one shown in Fig. 2a, with a Co thickness (tCo = 1.47 nm) leading to a SAF with vanishing magnetic anisotropy. b PL quenching image of a spin spiral state. c Line profile along the white dashed line in b. d Sketch of a SAF sample including an additional bias layer which enables the transformation of the spin spiral into antiferromagnetic skyrmions. The composition of the bias layer is Ta(10)/Pt(8)/[Co(0.6)/Pt(0.45)]3. e PL quenching image showing antiferromagnetic skyrmions in the biased-SAF sample. f Line profile across the skyrmion marked with the circle in e. The dashed line is data fitting with a Gaussian function. g Statistical distribution of the full width at half maximum w of the PL quenching spots, inferred from measurements over a set of 52 isolated skyrmions. The red dashed line is a fit with a normal distribution.

