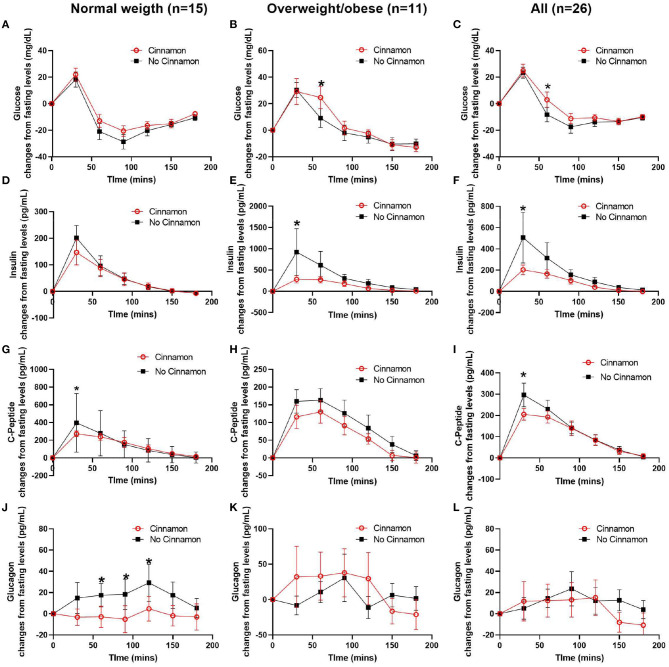
Figure 3.
Changes of serum glucose, C-peptide, insulin, and glucagon from fasting levels in normal weight (n = 15), overweight/obese (n = 11) participants, and all participants (n = 26). (A–C) glucose, (D–F) insulin, (G–I) C-peptide, and (J–L) glucagon, Data are mean ± SEMs, *Results were significant when P < 0.05 for comparison between cinnamon and group at each time point.

