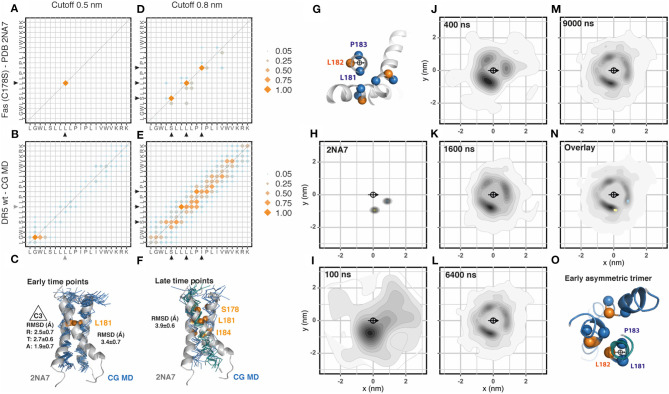
Figure 2.
Fas assembly. (A) Contact matrix of Fas C178S NMR (PDB:2na7) at 0.5 nm cut-off distance. The amino acid sequence corresponds to residues L174 to K193. Black arrowheads indicate the residues involved in these interactions. Data corresponds to the averaged 15 NMR models. Scales correspond to the number of contacts normalized to the most frequent one. (B) Same as (A), for Fas C178S CG-MD simulations. Gray arrowheads indicate non-conserved interactions observed only in the simulation. The analysis was performed on the full system (36 × 36) between 3 and 6 μs. (C) Alignment of the Fas NMR average model with a Fas CG-MD dimer arranged in a 3-fold symmetry axes (C3). This structure is formed at early simulation times (0.5–1 μs). The averaged root mean square deviation (RMSD) of the alignment is indicated on the right and the averaged radial (R), tangential (T), and axial (A) RMSD is indicated on the left. (D) Same as (A), but using a cut-off distance of 0.8 nm. (E) Same as (B), but using a cut-off distance of 0.8 nm. (F). Alignment of the Fas NMR average model with a Fas CG-MD trimer, together with the analysis of the averaged root mean square deviation (RMSD) of the alignment. This structure is formed at late time points (5–6 μs). (G) Residues chosen for the centroid and orientation vector used for radial distribution analysis. (H) Radial distribution analysis of the coarse grained Fas C178S NMR structure 2na7. The scale corresponds to the 2D-density function from the scatter plot, as described in Methods. (I–M) Radial distribution analysis of different snapshots of Fas C178S CG-MD at the indicated time points. (N) Overlay of the radial distribution of the reference structure (2na7, blue/yellow dots) and the CG-MD structures (gray density scale). (O) Example of an early trimer, where the third helix assembles in an asymmetric manner, generating the visible spot on top of the central helix.

