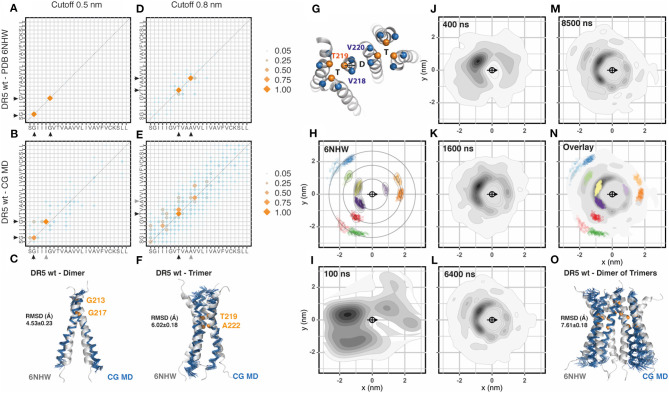
Figure 3.
DR5 assembly (A). Contact matrix of DR5 NMR (PDB:6nhw) at 0.5 nm cut-off distance. The amino acid sequence corresponds to residues S212 to L236. Black arrowheads indicate the residues involved in these interactions (GxxxG motif). Data corresponds to the averaged 15 NMR models. Scale corresponds to the number of contacts normalized to the most frequent one. (B) Same as (A), for DR5 coarse grained molecular dynamic (CG-MD) simulations. Black arrowheads indicate conserved interactions whereas gray arrowheads indicate non-conserved interactions. The analysis was performed on the full system (36 × 36) between 3 and 8 μs. (C) Alignment of DR5 NMR average dimer with a DR5 CG-MD dimer, together with the analysis of the averaged root mean square deviation (RMSD) of the alignment. (D) Same as (A), but using a cut-off distance of 0.8 nm. (E) Same as (B), but using a cut-off distance of 0.8 nm. (F) Alignment of DR5 NMR average model with a DR5 CG-MD trimer, together with the analysis of the averaged root mean square deviation (RMSD) of the alignment. (G) Residues chosen for the centroid and orientation vector used for radial distribution analysis. (H) Radial distribution analysis of coarse grained DR5 NMR structure 6nhw. Note that it is possible to identify dimers, trimers, and higher order assemblies in consecutive orbits. Scale corresponds to the 2D-density function from the scatter plot, as described in Methods. (I–M) Radial distribution analysis of different snapshots of DR5 CG-MD at the indicated time points. (N) Overlay of the radial distribution of the reference structure (6nhw, color dots) and the CG-MD structures (gray density scale). (O) Alignment of DR5 NMR average dimer of trimers with a DR5 CG-MD assembly, together with the analysis of the averaged root mean square deviation (RMSD) of the alignment.

