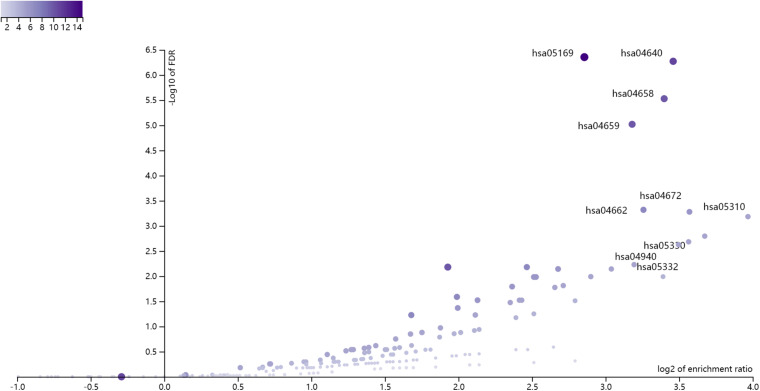
FIGURE 1.
The enrichment results of the 180 selected genes using WebGestalt. The x axis was log2 of enrichment ratio while the y axis was the -Log10 of FDR. The pathways on the top right corner were the significantly enrich pathways. It can be seen that hsa04640 Hematopoietic cell lineage was the enriched KEGG pathway.

