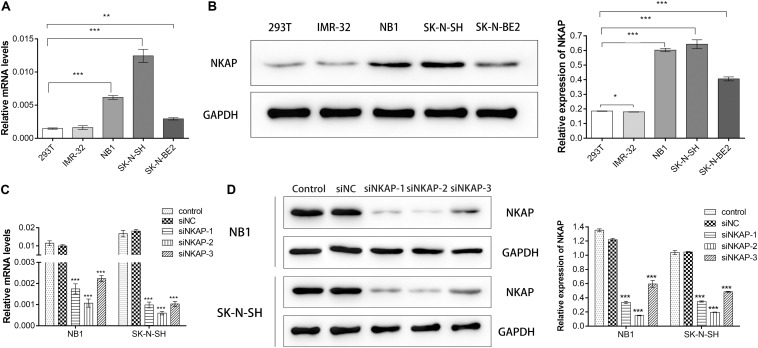
FIGURE 2.
Expression of NKAP in neuroblastoma cell lines and verify of knockdown efficiency of NKAP. NB1 and SK-N-SH cells were transfected with siNKAP-1, 2, and 3. Non-specific lentiviral vectors with non-specific were used as negative controls (siNC). (A) mRNA levels of NKAP were detected by quantitative real-time PCR. (B) Protein levels of NKAP were detected by Western blot. (C) Quantitative real-time PCR assay was performed to test knockdown efficiency of NKAP. (D) Western blot assay was performed to test knockdown efficiency of NKAP. All data were expressed as mean ± standard deviation of three independent experiments. ***P < 0.001, **P < 0.01, *P < 0.05.

