Figure 1.
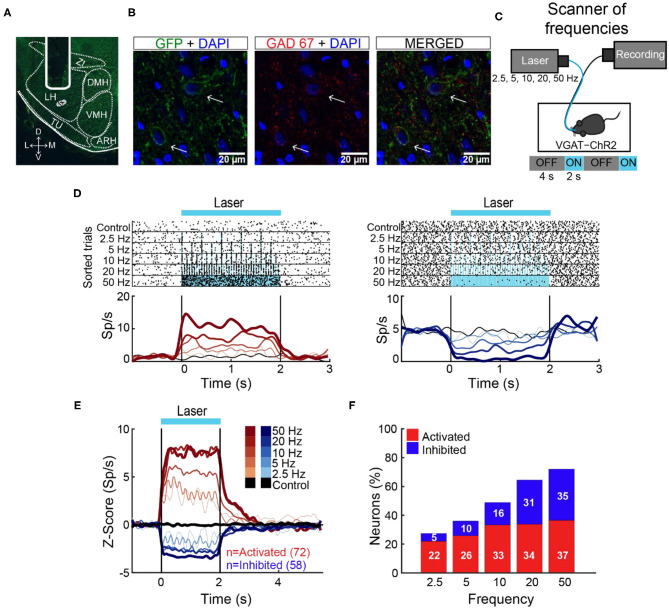
The 50-Hz stimulation evoked the largest LHA neuronal responses. (A) Representative location of an optrode in LHA of VGAT-ChR2 mice. (B) Confocal images from LHA immunostained for GFP (green), GAD67 (red), and DAPI (blue). Arrows indicate the colocalization of ChR2-EYFP and GAD67 (see merged). (C) Schematic of optrode recordings in LHA during control trials (with no-laser) and opto-stimulation at 2.5, 5, 10, 20, and 50 Hz delivered randomly. In each trial, the laser had a cycle of 2 s on and 4 s off. (D) Representative raster plots of two neurons recorded in LHA. The first one was activated (left panel), and the second inhibited (right panel) during opto-stimulation. Spiking responses were aligned (time = 0 s) to the first laser pulse. Black ticks depict action potentials and blue marks laser pulses. Below are the corresponding PSTHs (firing rates, Sp/s). Red and blue ascending gradients indicate the frequency of stimulation [see (E) for the color bar]. Black trace represents activity during control trials without laser. Vertical black lines indicate laser onset (time = 0 s) and offset (time = 2 s), respectively. (E) Normalized Z score population responses of LHA neurons recorded from n = 5 VGAT-ChR2 mice. Red and blue colors depict activated or inhibited responses, respectively, relative to baseline (−1 to 0 s) and thickness, and gradient colors indicate higher stimulation frequencies. Black trace illustrates neural activity during control trials for all recorded neurons (n = 186). (F) Percentage of neurons recruited as a function of stimulation frequency.

