Figure 2.
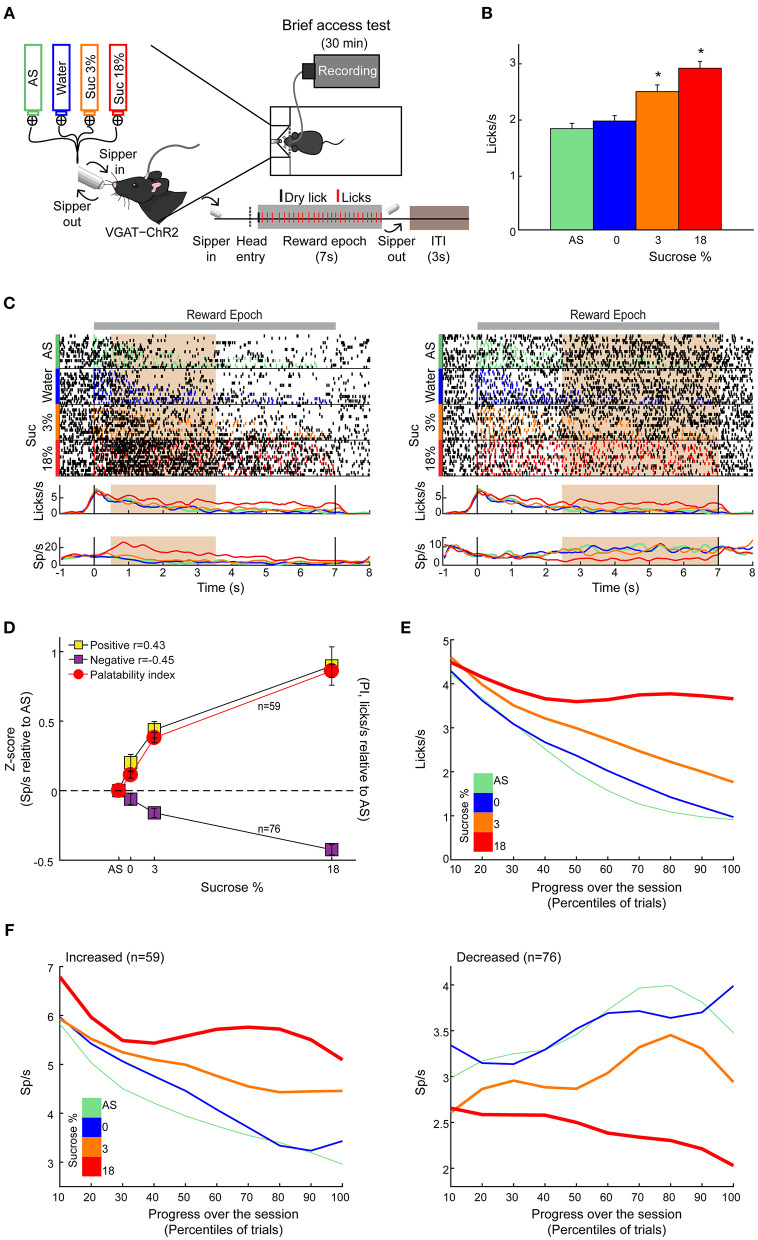
LHA neurons process palatability-related information. (A) Brief access taste setup depicting a behavioral box equipped with a computer-controlled retractile sipper that for each lick independently delivers a drop of artificial saliva (AS), water, sucrose 3%, or 18% concentrations. After a head entry (dashed line), the first dry lick (black line) enables the 7-s reward epoch. During this period, in each lick (red), a drop of the four tastants was randomly delivered. After the reward epoch, the sipper was retracted for an intertrial interval (ITI) of 3 s and then re-extended to start a new trial. (B) Average lick rate during the entire reward epoch, reflecting greater palatability as a function of sucrose concentration. * Indicates significant difference (p < 0.05) among the stimuli. Using one-way ANOVA followed by the Holm–Sidak test. (C) Representative raster plot of two LHA neurons recorded while mice performed a brief access test. Spikes are plotted as black ticks, whereas licks for each tastant are color-coded (green, AS; blue, water; orange, sucrose 3%; red, sucrose 18%). Below are the corresponding peristimulus time histograms (PSTHs) of lick rate (licks/s) and firing rate (spikes/s; Sp/s) as a function of trial type. Neuronal responses were aligned (time = 0 s) to the first rewarded lick. The brown rectangles depict the “best” window with the maximum Pearson correlation coefficient between firing rates and sucrose's palatability index (PI). The left and right raster plots displayed two neurons with a positive and negative correlation, respectively. (D) Z score normalized activity (relative to AS trials) for LHA neurons with either positive or negative correlation against PI (red circles). (E) Population PSTHs of the lick rates given in the reward epoch as a function of trial type, divided into blocks of 10th percentiles of trials each. (F) Population PSTHs of the firing rate during the reward epoch of the palatability-related neurons across the session for each trial type. The left panel depicts neurons that fired more to higher sucrose concentrations [positive sucrose's palatability correlation; (D) yellow], whereas the right panel illustrates neurons with decreasing firing rates as the sucrose concentration increased [i.e., negative correlation with sucrose's palatability; (D) purple].

