Figure 3.
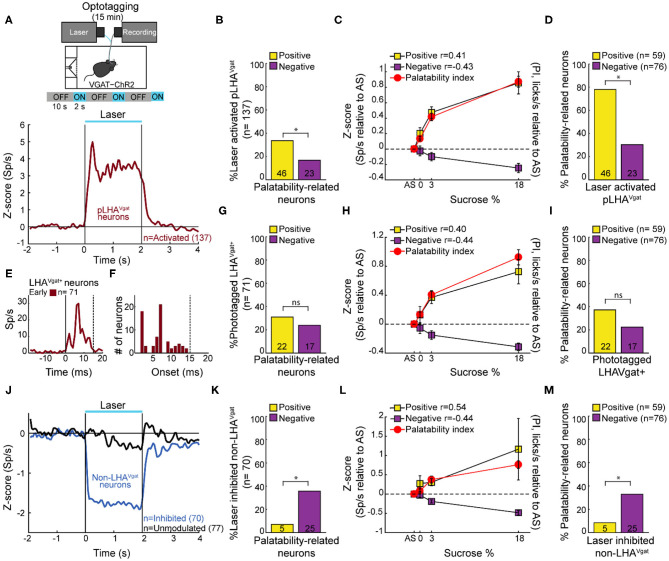
A subpopulation of LHAVgat+ neurons encodes sucrose's palatability. (A) To confirm the LHAVgat+ neurons' identity after the brief access test, we performed laser opto-stimulation in a cycle 2 s on (at 50 Hz) and 10 s off over 15 min session. In this phase, mice had no access to the sipper (above panel). Below, the normalized Z score population activity of all 284 LHA neurons recorded from three VGAT-ChR2 mice. Responses were aligned to the laser onset (time = 0 s), relative to baseline (−1 to 0 s) activity. The red line depicts the responses of activated putative pLHAVgat neurons. (B) Percentage of laser-activated pLHAVgat+ neurons whose activity (in the brief access test) also positively or negatively correlates with sucrose's PI. *p < 0.01, chi-square. (C) Z score activity (relative to AS) for all activated pLHAVgat neurons and its correlation with the sucrose's PI. (D) Percentage of positive or negative laser-activated palatability-related neurons. *p < 0.0001, chi-square. (E) PSTH of identified (opto-tagged) LHAVgat+ neurons exhibiting early evoked responses (i.e., ChR2 expressing cells). (F) Histogram of opto-tagged LHAVgat+ neurons with evoked early responses (latencies <15 ms) from laser onset. (G–I) The same conventions as in (B–D), but for opto-tagged LHAVgat+ neurons encoding sucrose's palatability. (J–M) Non-LHAVgat neurons that negatively encode sucrose's palatability. (J) Blue and black traces correspond to inhibited (non-LHAVgat+ neurons) and unmodulated responses, respectively. Same conventions as in (A). (K–M) The same conventions as in (B–D). *p < 0.001, chi-square.

