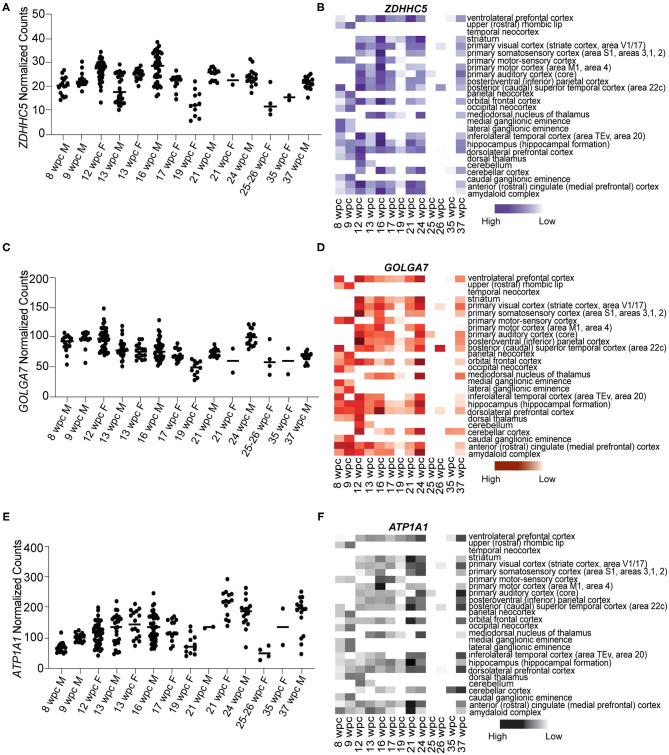
Figure 2.
Novel S protein interactors ZDHHC5, GOLGA7, and ATP1A1 are expressed throughout the fetal brain development. (A) Temporal expression of ZDHHC5 from 8 to 37wpc showing three peaks of expression at 12, 16, and 24wpc. (B) Heatmap representing spatio-temporal expression of ZDHHC5 across 26 different fetal brain regions ranging from 8 to 37wpc. (C) Temporal expression of GOLGA7 from 8 to 37wpc. Note peaks of expression at 12, 16, and 24wpc. (D) Heatmap representing spatio-temporal expression of GOLGA7 across 26 different fetal brain regions ranging from 8 to 37wpc. (E) Temporal expression of ATP1A1 from 8-37 wpc showing three peaks of expression at 21, 24 and 37 wpc. (F) Heatmap representing spatio-temporal expression of ATP1A1 across 26 different fetal brain regions ranging from 8 to 37wpc. In temporal expression graphs, each value corresponds to a specific region at that time point and horizontal black lines represent median value of gene expression at each time point. The heatmaps are scaled to column. White spaces represent lack of data for regions of interest at the corresponding timepoint.

