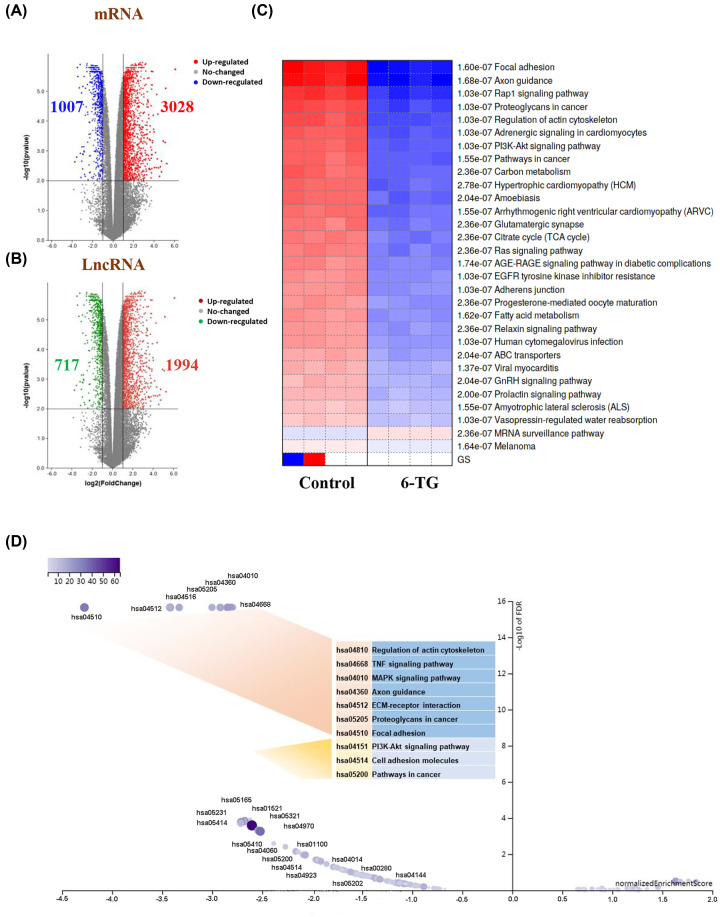
Figure 2. Differentially expressed gene analysis.
(A,B) Volcano plots of differentially expressed mRNAs and lncRNAs. The y-axis represents the negative log (base 10) of the FDR, and the x-axis represents the log (base 2) of FC. Each point represents a gene. The dots in blue or green denote down-regulated DEGs, the dots in red denote up-regulated DEGs, and the dots in black denote non-DEGs. (C) PGSEA heatmap of the DEmRNAs. (D) Volcano plot of GSEA results based on the KEGG pathway.

