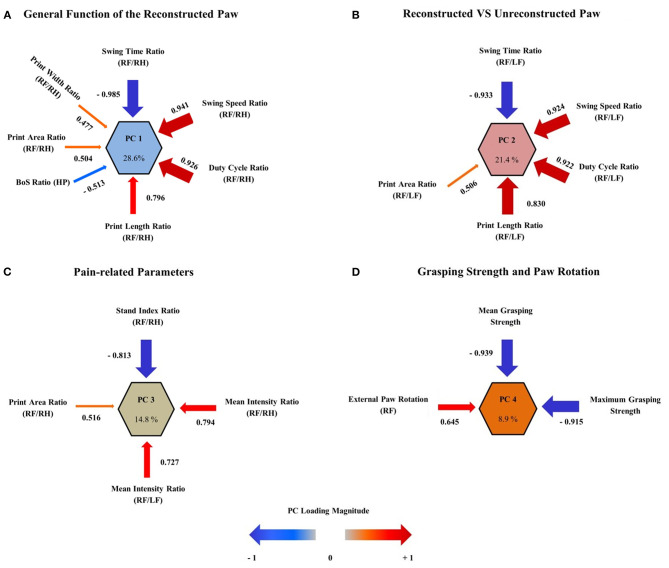
Figure 13.
Multivariate analysis of outcome parameters. By using principal component analysis (PCA), four principal component clusters (PCs) were extracted, which accounted for 73.6% of the variance in observed outcome after median nerve resection and autograft repair. The correlation (also referred to as “loadings”) of each outcome metric on the PC is represented as arrows, with the arrow size indicating the loading magnitude and the color indicating the valence of the loading. PC1 (A) represents the largest variance (28.6%) and relates to the general function of the reconstructed right front paw. PC2 (B) accounts for 21.4% of variance and represents the ratio of functionality between the reconstructed right and unreconstructed left front paw. The third primary component cluster, PC3 (C) contains four pain-related parameters of gait, reflecting the influence of pain perception on functional outcome. This component accounts for 14.8% of variance. PC4 (D) represents 8.9% of variance and reflects the muscle function of the long finger flexors (maximum and mean grasping strength) as well as of the flexor carpi radialis muscle (external paw rotation). Note that external paw rotation has a direction of loading opposed to the direction of loading of grasping strength, indicating the decrement of external paw rotation with increasing muscle reinnervation. The size of the arrows corresponds to the loading magnitude, while the color corresponds to the direction of loading.

