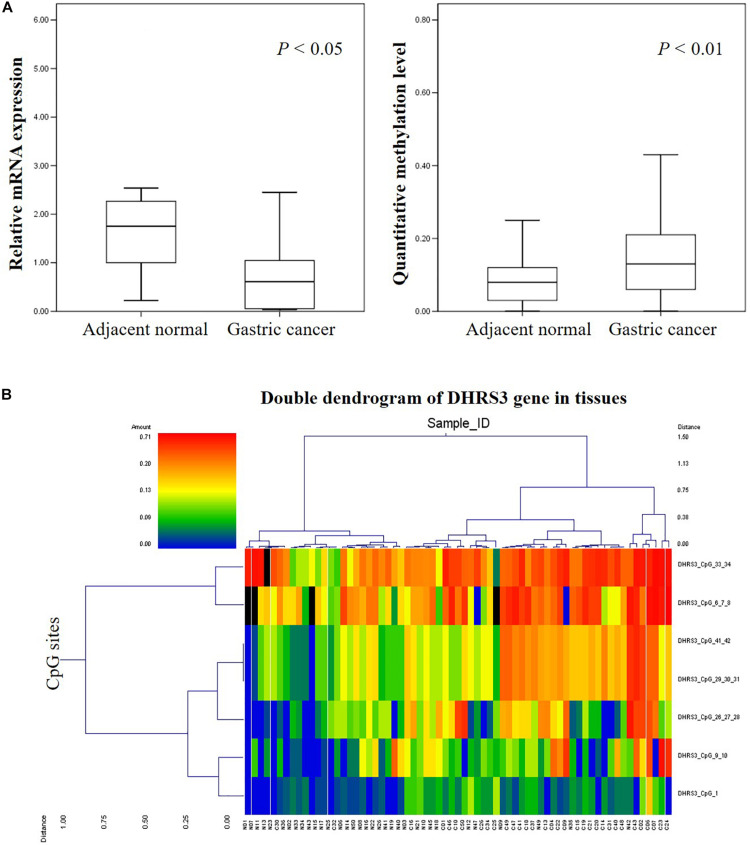
FIGURE 2.
High-throughput analysis of the informative CpG sites for the DHRS3 gene. (A) DHRS3 was hypermethylated and lacked mRNA expression in GC. (1) Box plots indicating the relative expression levels of DHRS3 mRNA in 21 paired GC tissues. Sample one served as a calibrator. P-values were estimated using a paired two-sample t-test. (2) Box plots indicating the quantitative DNA methylation analysis by Mass-Array. P-values were estimated using an independent samples t-test. (B) Two-way hierarchical cluster analysis of tumor tissues and adjacent normal tissues (red clusters are 71% methylated, green clusters are 0% methylated). The color gradient between red and green indicates methylation ranging from 0 to 71%, and black clusters indicate CpG sites that were not analyzed.

