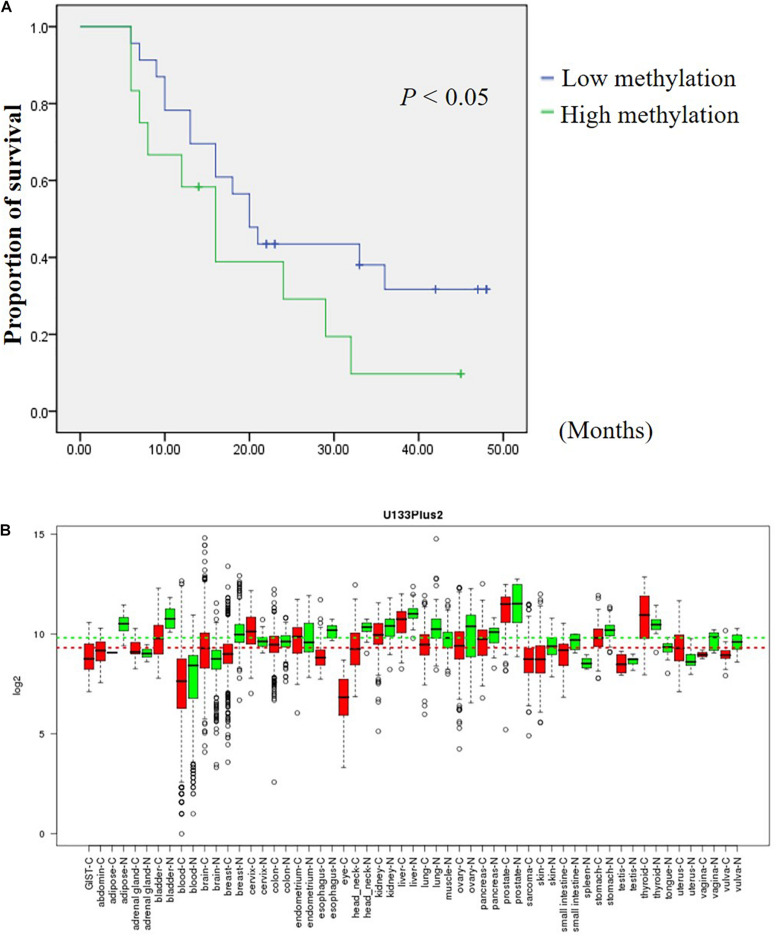
FIGURE 7.
DHRS3 is down regulated in various tumors and high methylation levels of DHRS3 was associated with poor survival. (A) Survival curves were plotted for Kaplan-Meier survival analysis. The methylation status of CpG 9 and CpG 10 of the GC samples was used as the variable to separate two groups. Patients with high levels of methylation had poorer survival times than those with low levels of methylation (P < 0.05). (B) Expression pattern of DHRS3 mRNA in normal and tumor tissues. DHRS3 mRNA in various types of cancer was searched for in the GENT database (http://medical-genomics.kribb.re.kr/GENT/). Boxes represent the median and 25th and 75th percentiles; dots represent outliers. Red boxes represent tumor tissues; green boxes represent normal tissues. Red and green dashed lines represent the average values for tumor and normal tissues, respectively.

