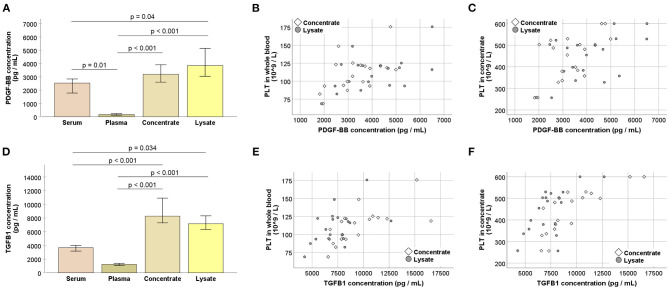
Figure 3.
(A,D) Platelet-derived growth factor (PDGF-BB; A) and transforming growth factor (TGFB1; B) concentrations at the different stages of blood processing; serum samples were directly drawn from each horse and the remaining values were obtained after pooling the replicate samples, i.e., blood bags, for each horse; samples were stored at −80°C before analysis; Friedman and Wilcoxon tests for group comparisons were performed (p-values are indicated); bars represent the median values, error bars the 95% confidence intervals. (B–F) Correlations between whole blood (B,E) or concentrate (C,F) platelet (PLT) counts and PDGF-BB (B,C) or TGFB1 (E,F) concentrations in concentrates as well as lysates (p < 0.05, based on Spearman's rank correlation). All data were obtained from n = 19 horses.

