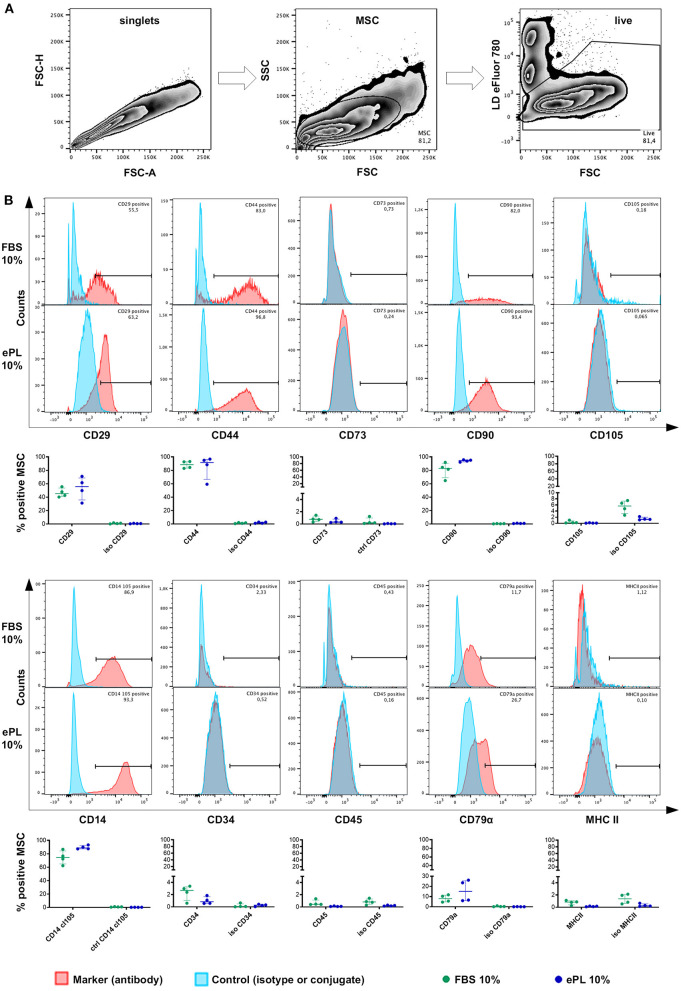
Figure 6.
Flow cytometry analysis of equine mesenchymal stromal cells (MSC) cultured with 10% fetal bovine serum (FBS) or 10% equine platelet lysate (ePL) after cells were mechanically detached and stained for 10 different surface markers. (A) Gating strategy for live MSC after duplet exclusion. (B) Representative examples of overlaid histograms of the surface marker staining and the respective isotype or conjugate control for MSC from one donor, and frequencies of surface marker positive MSC as % of live MSC plotted as individual values; horizontal bars mark the median and interquartile ranges. Data were obtained from MSC from n = 4 donors.

