Figure 7.
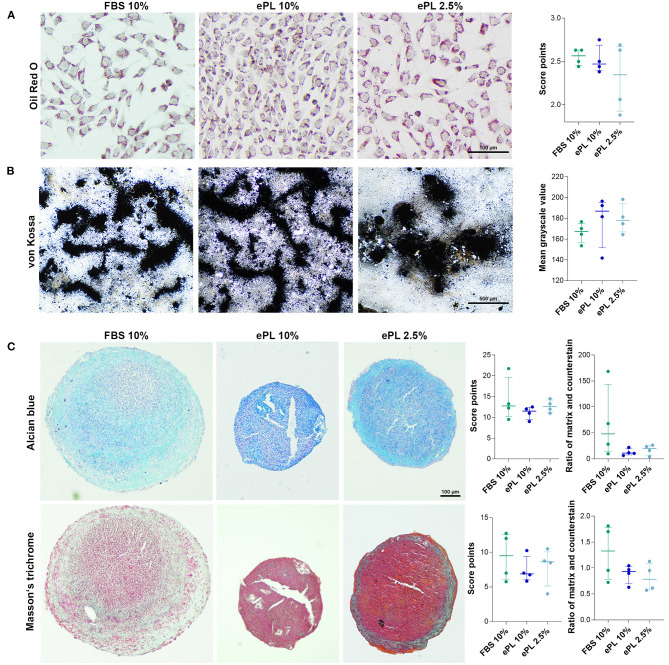
(A) Representative brightfield photomicrographs of equine mesenchymal stromal cells (MSC) after adipogenic (A), osteogenic (B), and chondrogenic (C) differentiation and corresponding data obtained by scoring (A,C) and image analysis using Fiji ImageJ (B,C). MSC were cultured in the media indicated before differentiation was induced (FBS, fetal bovine serum; ePL, equine platelet lysate). The plots display the individual values, median, and interquartile ranges. Data were obtained from MSC from n = 4 donors.

