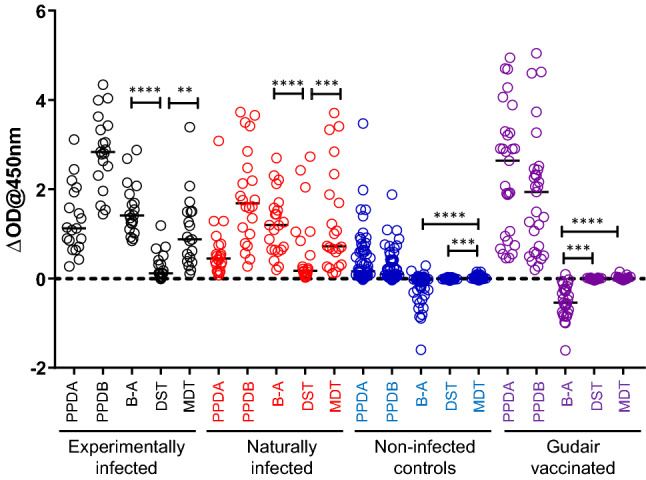
Figure 2.

Quantification of MDT and DST induced in vitro IFN-γ production. Blood samples from cattle experimentally infected with M. bovis (n = 22), cattle naturally infected with M. bovis (n = 21), naive controls (n = 59) and Gudair vaccinates (n = 29) were stimulated in vitro with PPDs, DST and MDT reagents and IFN-γ production measured by ELISA. Each symbol represents an individual animal while horizontal lines represent group medians. **p < 0.01, ***p < 0.001, ****p < 0.0001, Friedman test with Dunn’s multiple comparisons test.
