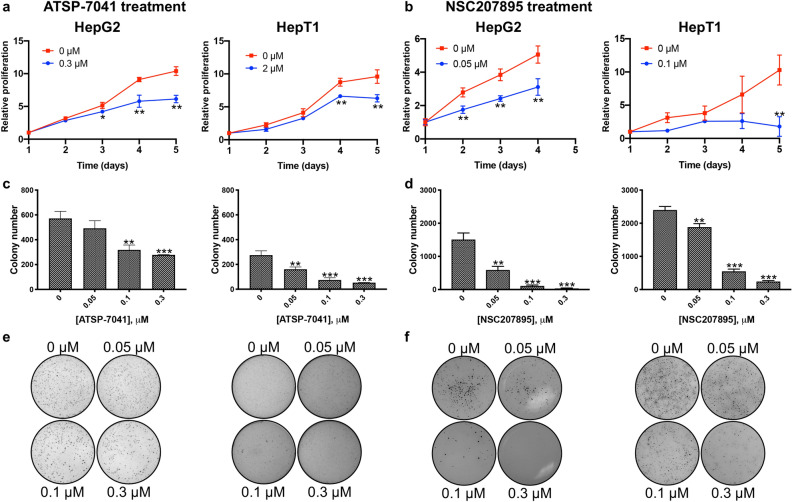
Figure 4.
Inhibition of MDM4 leads to decreases in proliferation. (a) HepG2 and HepT1 cells were exposed to ATSP-7041 for 120 h and MTT assays were done at 24 h intervals to assess cell number. Data shown are representative of at least three independent experiments performed with three replicate wells each time. Error bars represent SD. Student’s t test *P < 0.05, **P < 0.01, ***P < 0.001. (b) HepG2 and HepT1 cells were exposed to NSC207895 for 96 or 120 h and MTT assays were done at 24 h intervals to assess cell number. Data shown are representative of at least three independent experiments performed with three replicate wells each time. Error bars represent SD. Student’s t test *P < 0.05, **P < 0.01, ***P < 0.001. (c, e) Cells were maintained in anchorage-independent conditions on a soft agar base with ATSP-7041 or vehicle for 2 to 3 weeks before staining with 500 μl of MTT solution for 4 h to visualize colonies. Images were captured by a VersaDoc Imaging System and colonies were counted with Quantity One software. Bar graphs in c represent colony numbers in indicated conditions. Data shown are representative of at least three independent experiments performed with three replicate wells each time. Error bars represent SD. Student’s t test *P < 0.05, **P < 0.01, ***P < 0.001. (d, f) Cells were maintained in anchorage-independent conditions on a soft agar base with NSC207895 or vehicle for 2 to 3 weeks before staining with 500 μl of MTT solution for 4 h to visualize colonies. Images were captured by a VersaDoc Imaging System and colonies were counted with Quantity One software. Bar graphs in d represent colony numbers in indicated conditions. Data shown are representative of at least three independent experiments performed with three replicate wells each time. Error bars represent SD. Student’s t test *P < 0.05, **P < 0.01, ***P < 0.001.

