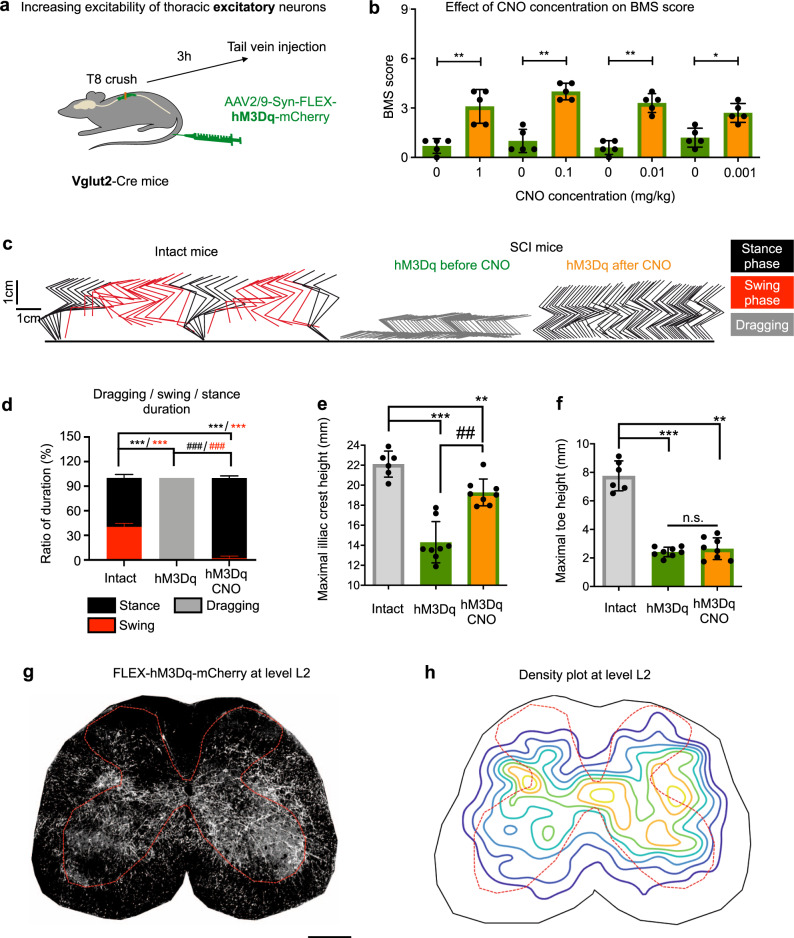
Fig. 3. Activation of thoracic excitatory neurons improves standing but only minimal stepping in mice with T8 crush injury.
a Experimental schematic. After a T8 crush injury, Vglut2-Cre mice received a tail vein injection of AAV2/9-Syn-FLEX-hM3Dq-mCherry and were then subjected to behavioural assessments at indicated time points. b BMS scores of Vglut2 mice expressing excitatory hM3Dq in thoracic neurons before and 1 h after CNO at different doses (n = 5). Data shown as mean ± SD (also for other panels in this figure). Two tailed paired t test; **p = 0.010 (1 mg/kg); 0.002 (0.1 mg/kg); 0.0013 (0.01 mg/kg); *p = 0.0132 (0.001 mg/kg). c Stickviews of kinematic analysis of intact mice and Vglut2 mice expressing excitatory hM3Dq before and after CNO (0.01 mg/kg). The phases of dragging, stance, or swing were marked in indicated colours. Data from intact mice are replotted from Fig. 2c for comparison. d Duration of swing, stance and dragging phases of different groups of mice with CNO (0.01 mg/kg). Data from intact mice are replotted from Fig. 2e for comparison. Two tailed sign test was used for within-group comparison (#) and Wilcoxon rank sum was used for between-group comparison (*). ***/###p < 0.001, n = 6 for each group. Quantification of the maximum iliac crest heights (e) and maximum toe heights (f). Two tailed paired t test for within group comparison (#) and 2 sample t test for between group comparison (*). **p = 0.0019; ##p = 0.0078, ***p < 0.001 and n.s. p = 0.5001. n = 6 (intact) and n = 8 (hM3Dq). Data from intact mice are replotted from Fig. 2f, g for comparison. A representative mCherry image (g) and average density plot (h) of an L2 transverse section showing the distribution of descending projection axons in the lumbar spinal cord of injured Vglut2-Cre mice with injection of AAV2/9-Syn-FLEX-hM3Dq-mCherry. n = 3 mice, 3–4 sections per mouse. Scale bar: 250 µm.

