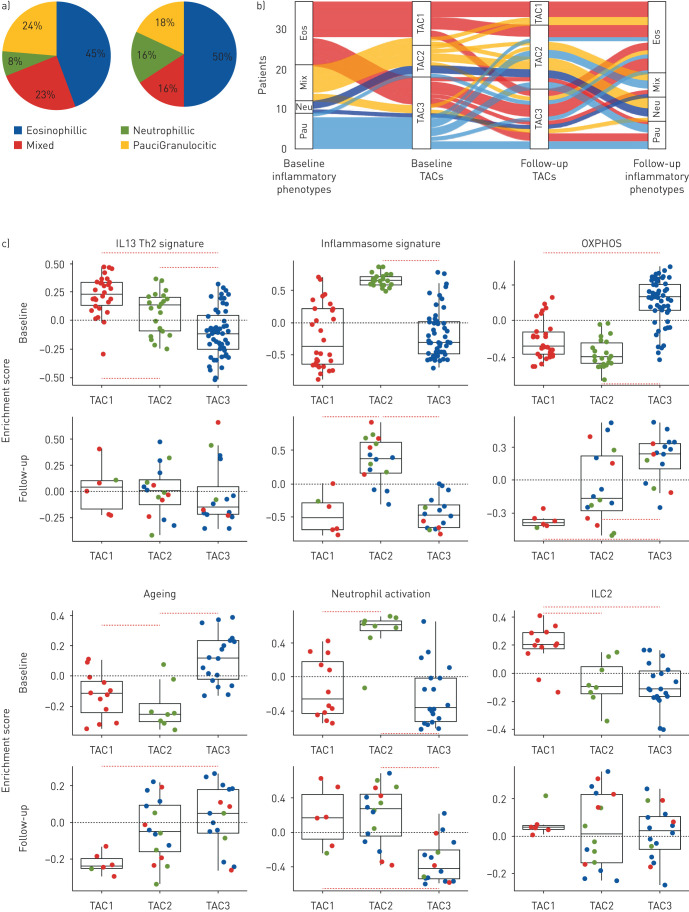
FIGURE 1.
a) Pie charts showing the distribution of granulocytic inflammation measured in sputum cells in 38 patients with severe asthma at first visit and at follow-up at 1 year. Eosinophilia defined as eosinophil count ≥1.5%; neutrophilia as neutrophil count ≥74%; mixed as neutrophilic and eosinophilic; and paucigranulocytic as neither neutrophilic nor eosinophilic. b) Sankey plot showing the flow of transcription-associated cluster (TAC) membership and sputum granulocyte inflammation at baseline and at 1 year. Eos: eosinophilic; neu: neutrophilic; mix: mixed eosinophilic and neutrophilic; pauci: paucigranulocytic. c) Dot plot relative enrichment scores with box and whisker plots showing median and interquartile range for six pathway signatures assessed at baseline (upper panels), and at 1 year follow-up (lower panels) on sputum transcriptomics using gene set variation analysis. Patient samples are colour-based according to baseline cluster membership in the TACs. ILC2: innate lymphoid cell type 2; IL-13/Th2: interleukin-13/T-helper type 2; OXPHOS: oxidative phosphorylation.

