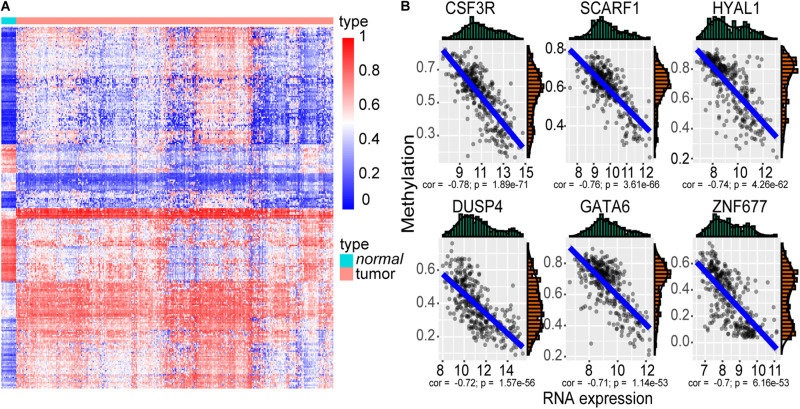
FIGURE 2.
The methylation driver genes. (A) Heatmap of the 277 methylation driver genes. The color from blue to red indicates the trend from hypomethylation to hypermethylation. (B) Scatter plot of the top six negatively correlated genes. The x-axis represents the RNA-seq expression value, and the y-axis represents the methylation beta value.

