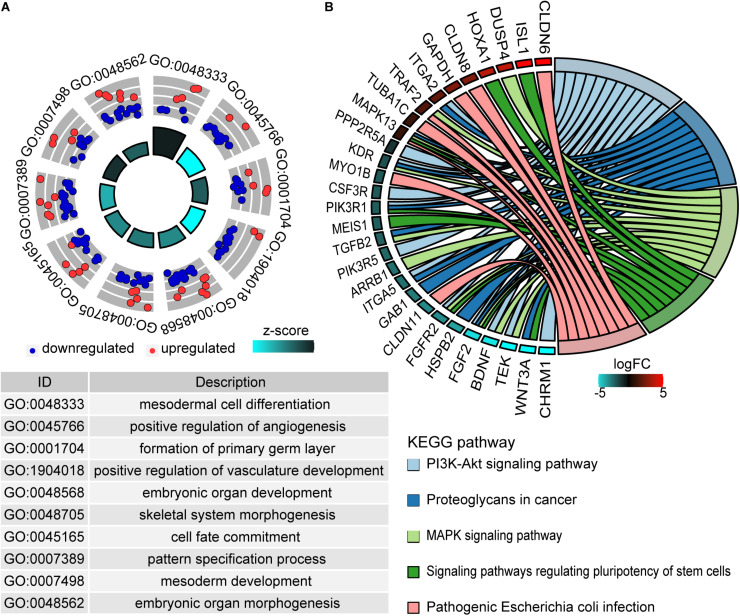
FIGURE 3.
Functional enrichment analysis of methylation driver genes. (A) The top 10 enriched terms of the biological process of GO. The outer circle represents the expression values (log2FC) of methylation driver genes in each enriched GO term. Red dots imply upregulated genes and blue dots imply downregulated genes. The inner circle indicates the significance of GO terms. (B) The chord plot of top five KEGG enriched pathways. The left outer semicircle represents the log2FC value of methylation driver genes, and the right semicircle corresponds to five pathway entries.

