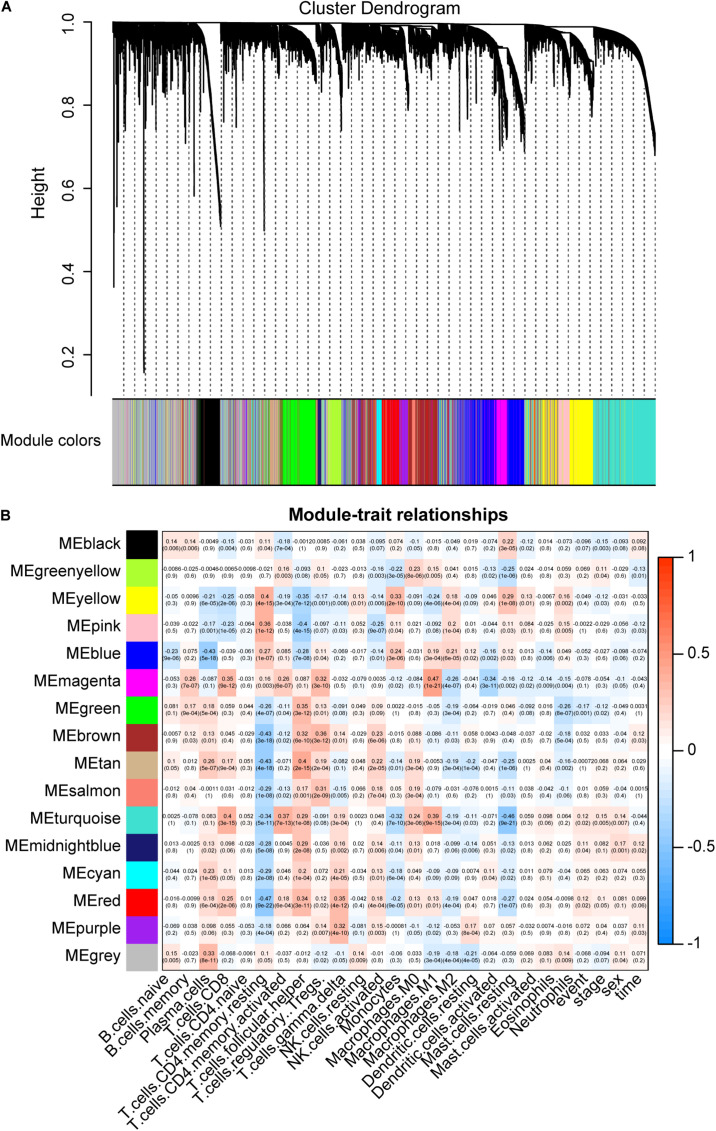
FIGURE 4.
Key modules and its correlation with CIBERSORT immune fractions. (A) Gene modules identified by hierarchical clustering. A total of 15 non-gray modules were generated. (B) The correlation between modules and CIBERSORT immune fractions. The turquoise module depicts the highest correlation (r = 0.4, p = 3e-15) with CD8 T cells.

