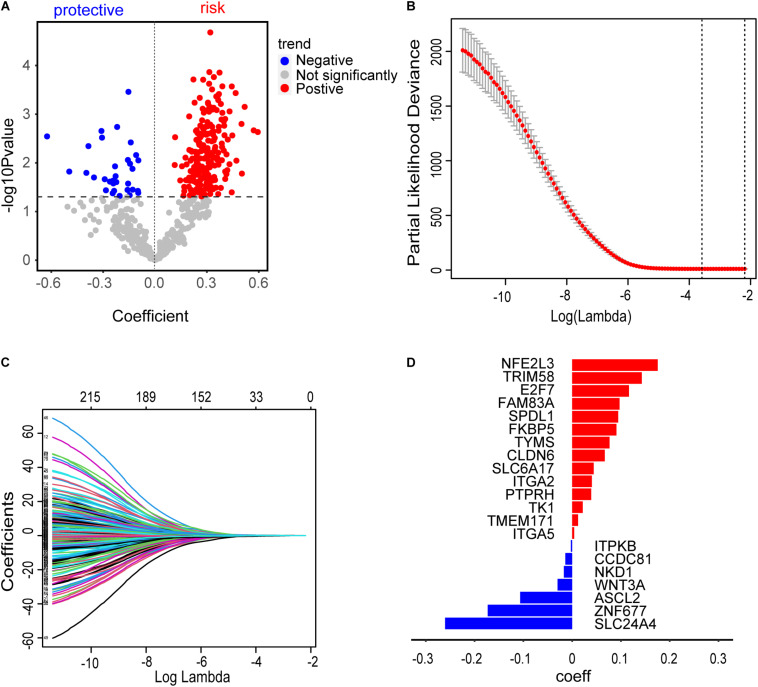
FIGURE 5.
Construction of risk assessment signature. (A) 241 promising candidates (P ≤ 0.05), including 32 protective and 209 risk markers. (B) The optimal λ value of 0.02774519 was selected to identify the most robust markers for prognosis in LASSO regression. (C) A combination of 21 genes remained with their individual non-zero LASSO coefficients. (D) The distribution of LASSO coefficients of the gene signature. The blue bars represent protective biomarkers and the red bars represent risk biomarkers.

