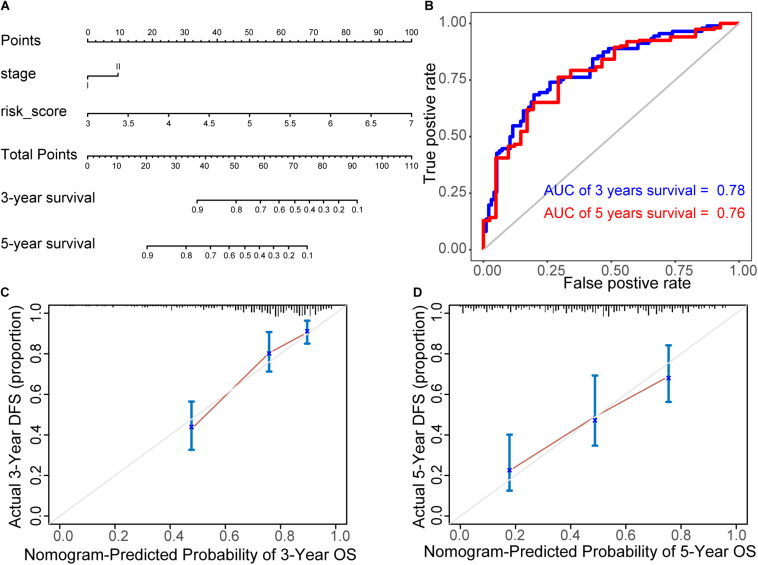
FIGURE 7.
Construction of prognostic nomogram. (A) Nomogram for predicting 3- and 5-year survival probability, by integrating 21 biomarkers, age, risk score, sex, and tumor stage. (B) ROC curves of the nomogram. In the time-dependent ROC curve, the nomogram also displayed a robust performance in predicting the 3- and 5-year survival rates. The AUC was 0.78 and 0.76, respectively. (C,D) The calibration curves of 3- and 5-year survival rates. They showed an optimal agreement between the nomogram predictions and actual observations.

