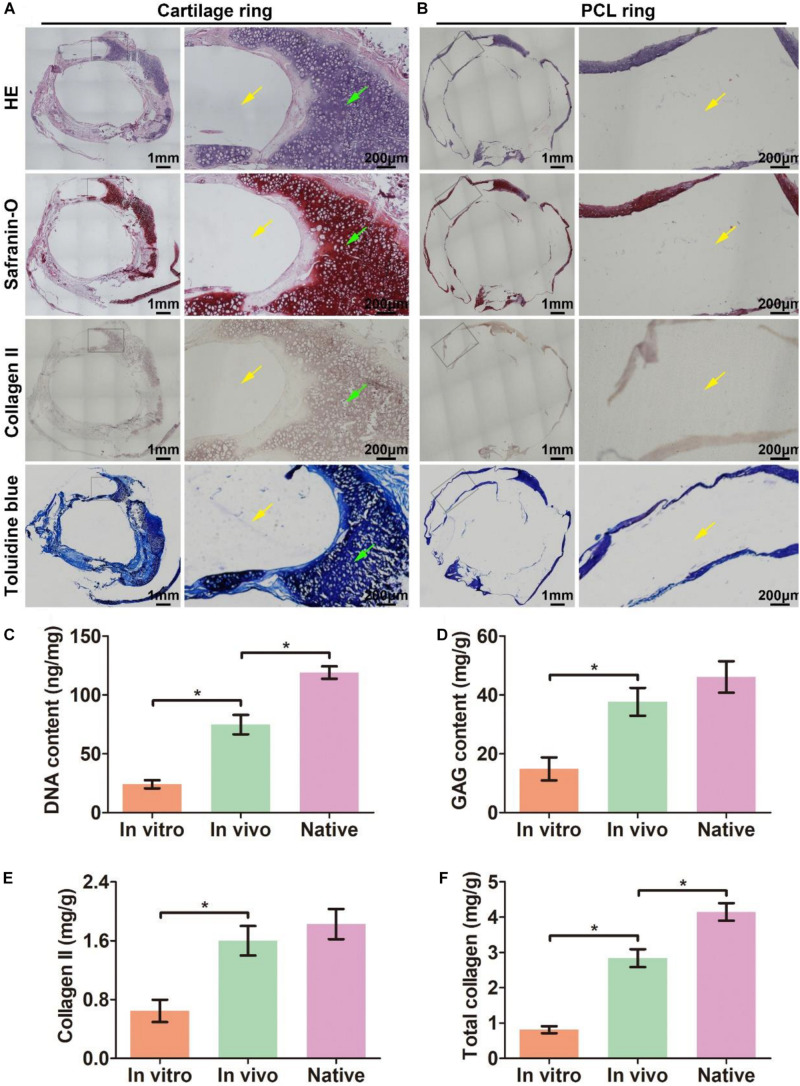
FIGURE 5.
Histological analysis of a transverse section of in vivo engineered biomimetic trachea and biochemically quantitative evaluation. HE, safranin-O, collagen II, and toluidine blue staining of a transverse section of the in vivo engineered biomimetic trachea and representative magnified images of the cartilage ring (A). HE, safranin-O, collagen II, and toluidine blue staining of a transverse section of the in vivo engineered trachea and representative magnified images of the PCL ring (B). The green arrows indicate cartilage regions, and the yellow arrows indicate PCL regions. Quantitative measures of the DNA content (C), GAG content (D), collagen II content (E), and total collagen content (F) in samples engineered in vitro and in vivo as well as its native tracheal counterpart. N = 3 per group. *P < 0.05.

