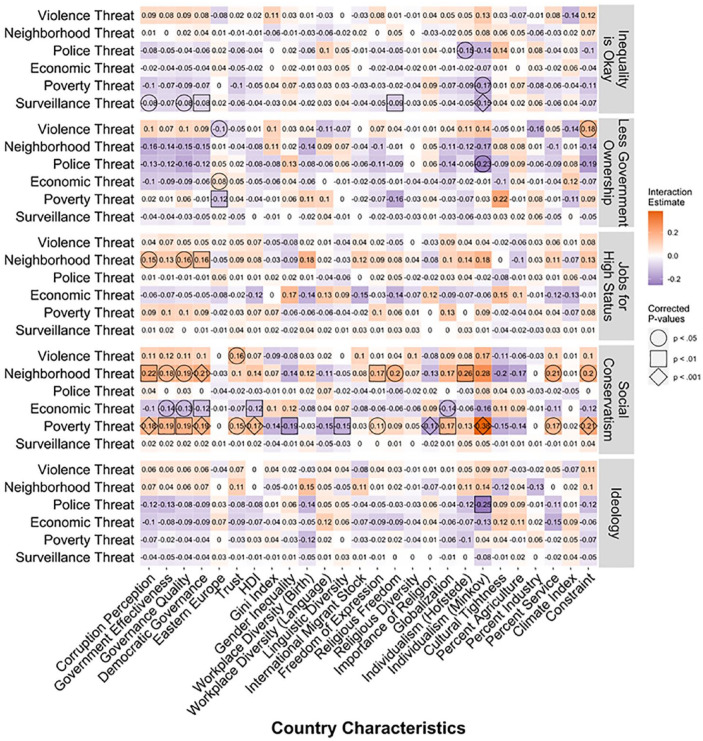
Figure 7.
Estimates for the interaction between-ountry characteristics (x-axis) and threats (y-axis) for the five measures of political beliefs (row chunks).
Note. Estimates that are significant using the Holm’s correction are highlighted with geometric shapes. For example, the interaction between corruption perceptions (x-axis) and surveillance threat (y-axis) when predicting ideology (bottom row chunk) is −.04 and is nonsignificant (no geometric shape). The interaction between corruption perceptions (x-axis) and poverty threat (y-axis) when predicting social conservatism (second to bottom row chunk) is .18 and is significant a p < .001 (diamond geometric shape).

