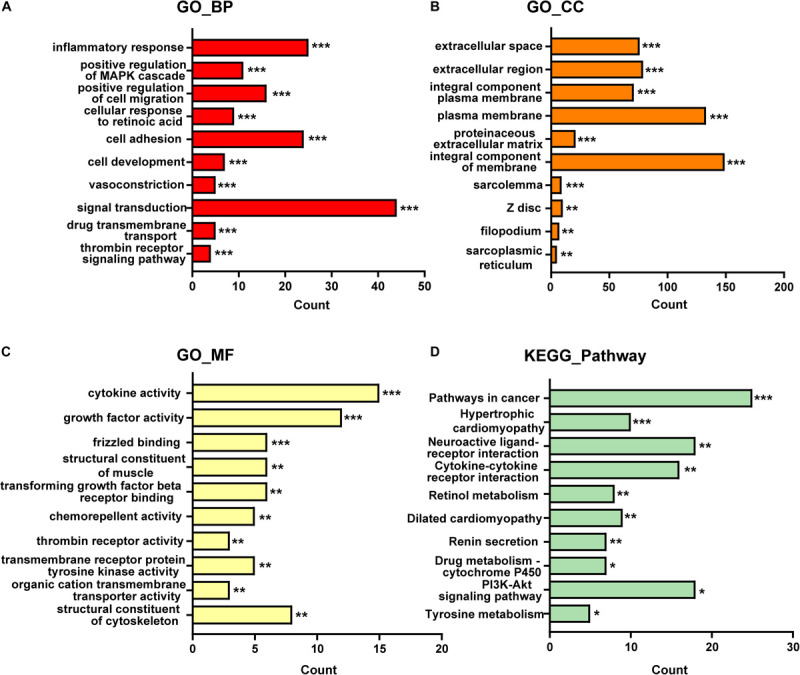
FIGURE 1.

The top 10 items of GO and KEGG enrichment analysis for DE-mRNAs in GSE97358. (A) GO-biological processes analysis of top 10 items. (B) GO-cellular components analysis of top 10 items. (C) GO-molecular functions analysis of top 10 items. (D) KEGG pathway analysis of top 10 items. The x-axis indicated the counts of enrichment genes. *P < 0.05, **P < 0.01, ***P < 0.001.
