FIGURE 2.

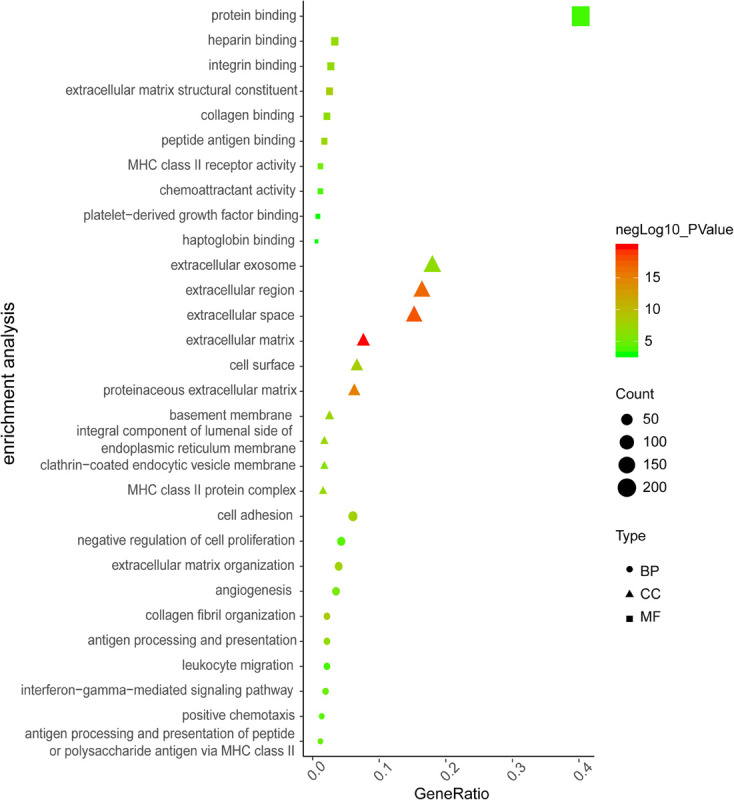
The top 10 items of GO enrichment analysis for DE-mRNAs in GSE116250. The color indicates value of negative log10 (P-value), dot size indicates enriched gene counts, and shape indicates the type of GO analysis.

The top 10 items of GO enrichment analysis for DE-mRNAs in GSE116250. The color indicates value of negative log10 (P-value), dot size indicates enriched gene counts, and shape indicates the type of GO analysis.