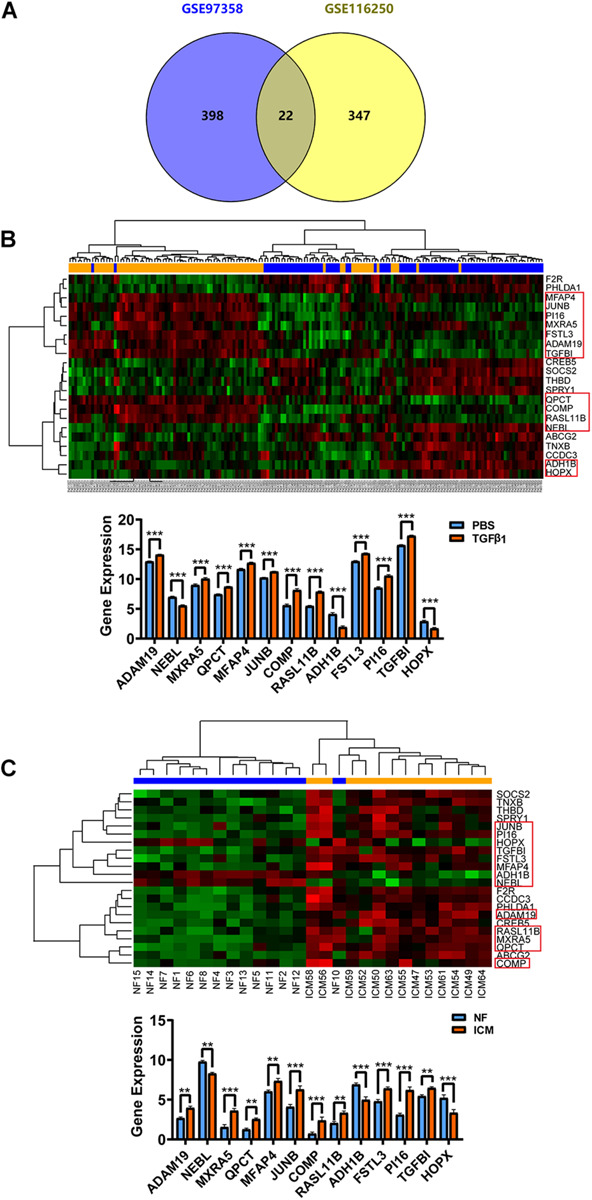
FIGURE 3.

Cardiac fibroblast-specific DE-mRNA derived from the overlap of in vivo (GSE116250) and in vitro (GSE97358) data. (A) Venn diagram for the 22 DE-mRNA overlap in GSE116250 and GSE97358 datasets. (B) Heatmap of the 22 DE-mRNA and statistical analysis for relative expression of the 13 DE-mRNA derived from the GSE97358 dataset. (C) Heatmap of the 22 DE-mRNA and statistical analysis for relative expression of the 13 DE-mRNA in the GSE116250 dataset. Thirteen DE-mRNA symbolized by a rectangle denoted that the expression tendency of these mRNA was toward the same direction. *P < 0.05, **P < 0.01, ***P < 0.001.
