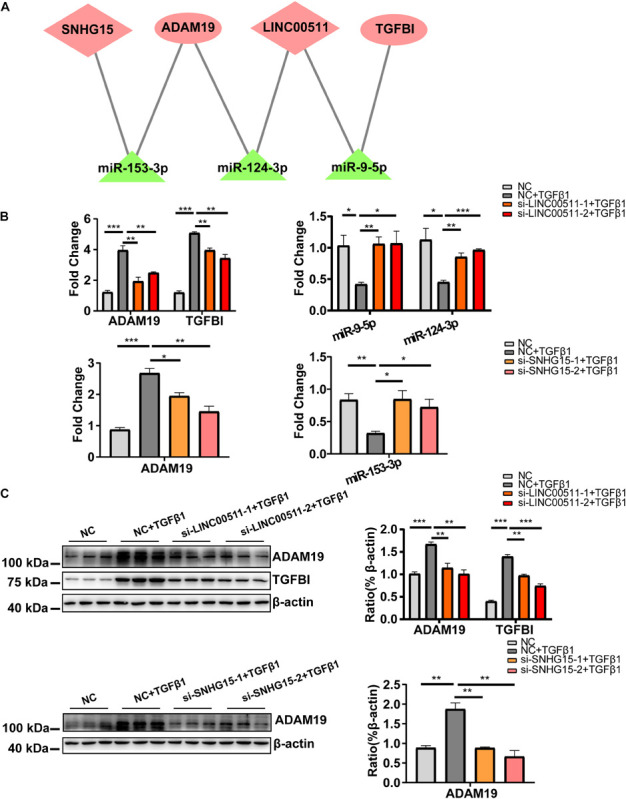
FIGURE 5.

Construction and validation of a cardiac fibrosis ceRNA network. (A) ceRNA network of cardiac fibroblast-specific differentially expressed genes during fibrosis. Pink indicates up-regulated genes and green indicates down-regulated genes. (B) RT-qPCR validation for quantitative dynamic changes of three microRNA and two mRNA under LINC00511 and LncRNA SNHG15 depletion. (C) Dynamic changes in protein level of ADAM19 and TGFBI. n = 3 per group. *P < 0.05, **P < 0.01, ***P < 0.001.
