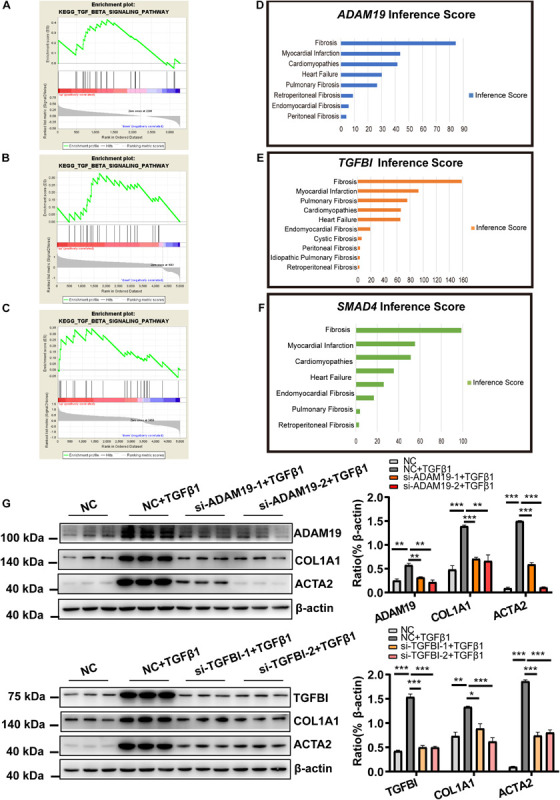
FIGURE 6.

Functional analysis of mRNA in the ceRNA network (ADAM19 and TGFBI). (A) Enriched TGF-β1 signaling pathway for TGFBI in the GSE116250 dataset. (B) Enriched TGF-β1 signaling pathway for TGFBI in the GSE97358 dataset. (C) Enriched TGF-β1 signaling pathway for ADAM19 in the GSE116250 dataset. (D) Inference Score for ADAM19. (E) Inference Score for TGFBI. (F) Inference Score for SMAD4. (G) Knockdown of expression of ADAM19 and TGFBI reduced expression of myofibroblast-associated genes. n = 3 per group. *P < 0.05, **P < 0.01, ***P < 0.001.
