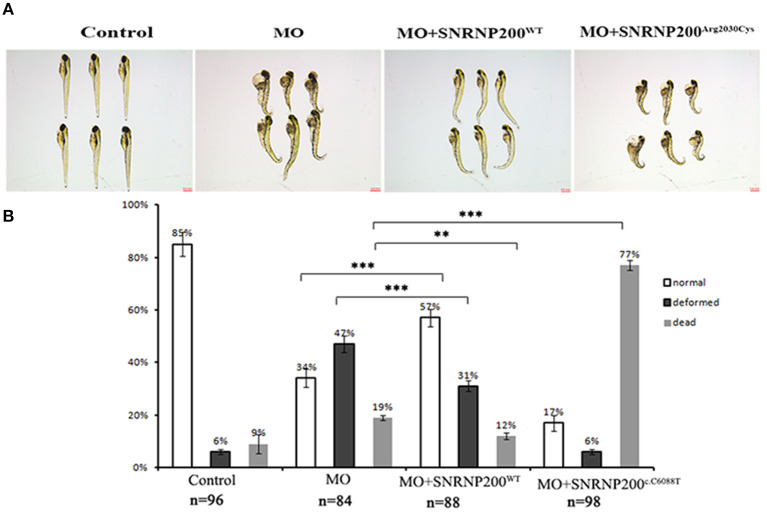
Figure 6.
Phenotypic comparison among zebrafish larvae with SNRNP200 silencing, and with overexpression of SNRNP200WT, or SNRNP200c.C6088T. (A) Systemic phenotype of zebrafish larvae injected with 4 ng Control-MO (control); 4 ng SNRNP200-MO (MO); 4 ng SNRNP200-MO +200 pg SNRNP200WT mRNA (MO + SNRNP200WT); and 4 ng SNRNP200-MO+200 pg SNRNP200c.C6088T mRNA(MO + SNRNP200c.C6088T). (B) phenotype distribution in four groups injected variously as shown in (A) including normal, deformed and dead ones were calculated from 1 to 3 dpf. The percentage of those are shown in the graph. Comparing with the group injected with SNRNP200-MO, the group of injection of MO + SNRNP200WT particularly reduced the ratio of deformed and dead larvae, whereas injection of MO + SNRNP200c.C6088T significantly raise the rate of death (34 vs. 77%, P < 0.001). Data are shown as mean + SD from technical triplicates. n: total number of larvae for each group from triple experiment. **P < 0.01, ***P < 0.001.

