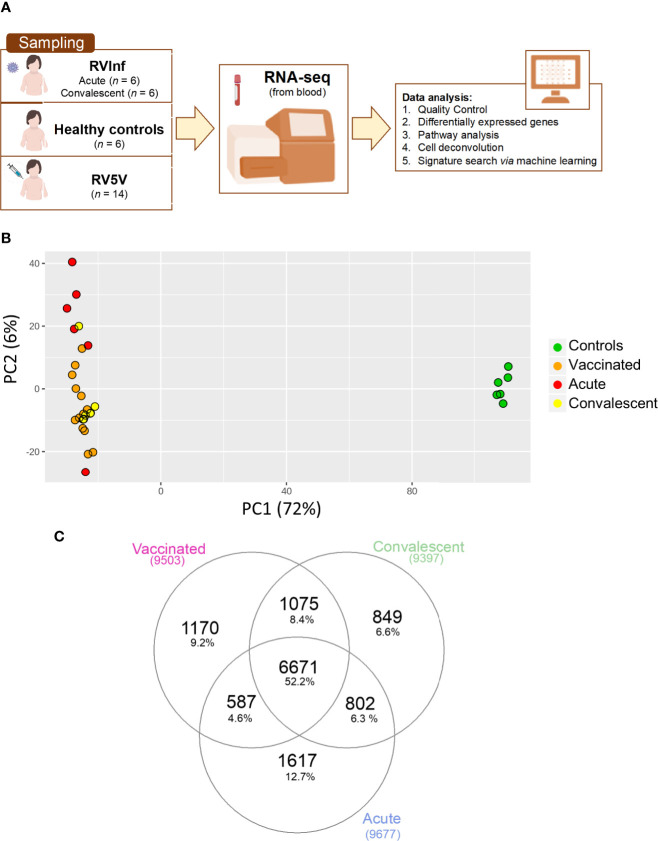
Figure 1.
(A) Scheme of sampling and project design; (B) Principal component analysis (PCA) built with the top 500 most highly expressed genes; (C) Venn plot of the DEGs when comparing healthy controls vs. vaccinated children and healthy controls vs. acute and convalescent infected (community-acquired) children, corrected by age and gender.

