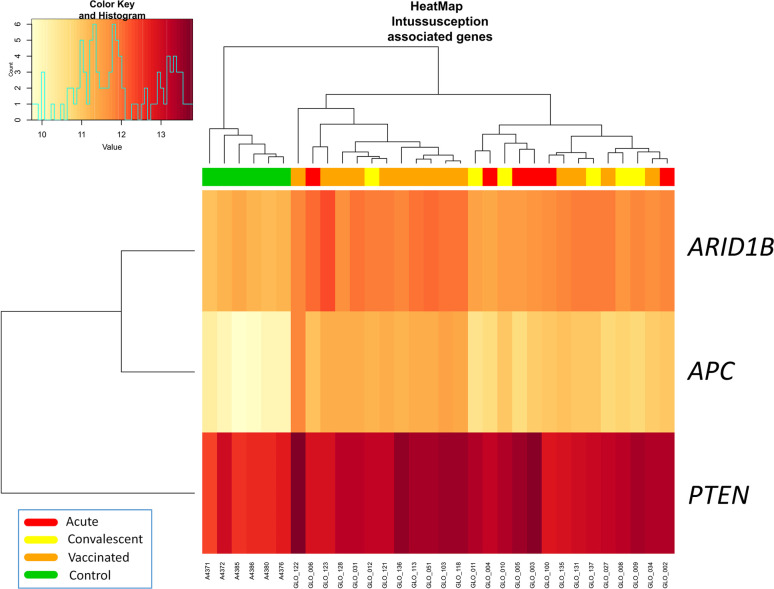
Figure 2.
Two-way hierarchical clustering analysis heat map of DEGs associated with intussusception according to IPA. Each row represents one transcript; each column represents one patient, with a red bar above indicating the sample status red (acute), yellow (convalescent), orange (vaccinated), green (control). Expression intensity is indicated by color (high expression in red; low expression in yellow).

