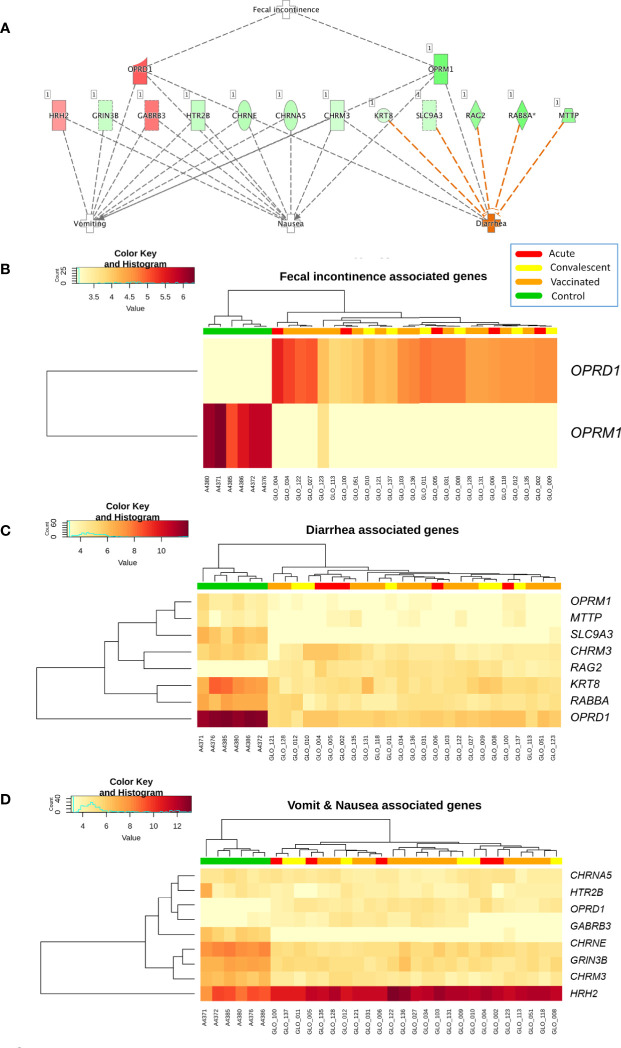
Figure 3.
(A) Network of biomarkers associated to fecal incontinence, diarrhea, nausea, and vomiting within the genes differentially expressed between vaccinated and healthy controls according to IPA. The genes in red background are upregulated and the green ones are downregulated; (B) Two-way hierarchical clustering analysis heat map of the genes associated to fecal incontinence within the DEGs between vaccinated and healthy controls according to IPA; (C) Two-way hierarchical clustering analysis heat map of the genes associated to diarrhea within the DEGs between vaccinated and healthy controls according to IPA; and (D) Two-way hierarchical clustering analysis heat map of the genes associated to nausea and vomit within the genes differentially expressed between vaccinated and healthy controls according to IPA. See Figure 2 for more information on color legend.

